
The question we see most on Reddit right now goes like this. The click-through rate is good. People land on the page. Nobody adds to cart.
One post in r/FacebookAds this month put it plainly: "1,000 visitors, over 90% leave instantly without scrolling, 0 add to carts." The brand had spent €600 on 32k impressions. Clarity showed "about 5 seconds average time on page and 10% scroll depth". They had already swapped the page three times ("product page, story advertorial, listicle") and got the same result each time.
The replies split in two. Half said it's bots and there's nothing you can do. The other half said it's the page. Both can be true, and you can tell which one it is with tools you already have.
A good CTR means people wanted to know more. So the next place to look is past the ad, at what happens after the click. Here's the order we'd check it in.
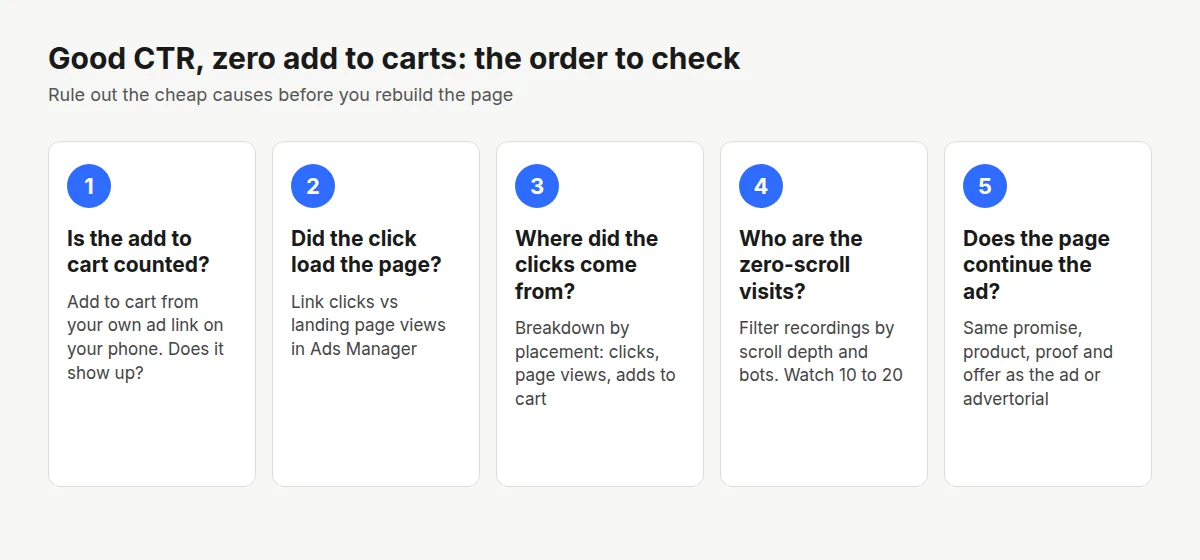
1. Make sure the add to cart is being counted
Start with the boring one. Open your own ad link on your phone, add the product to the cart, and check that the add to cart shows up wherever you're reading it, in Ads Manager and in your store's reports.
If it doesn't show up, the zero is a tracking problem, not a buyer problem. It's worth five minutes before you spend another dollar. When it does show up, you can compare your numbers to the rates in our DTC landing page conversion benchmarks.
2. Compare link clicks to landing page views
A link click is the tap on the ad. A landing page view is something else. Meta's help page for the metric says landing page views "let you know how many times your website loaded after your ad was clicked." It goes on: "You can compare landing page views to link clicks to understand how many times people may have clicked on your ad but left before your website loaded."
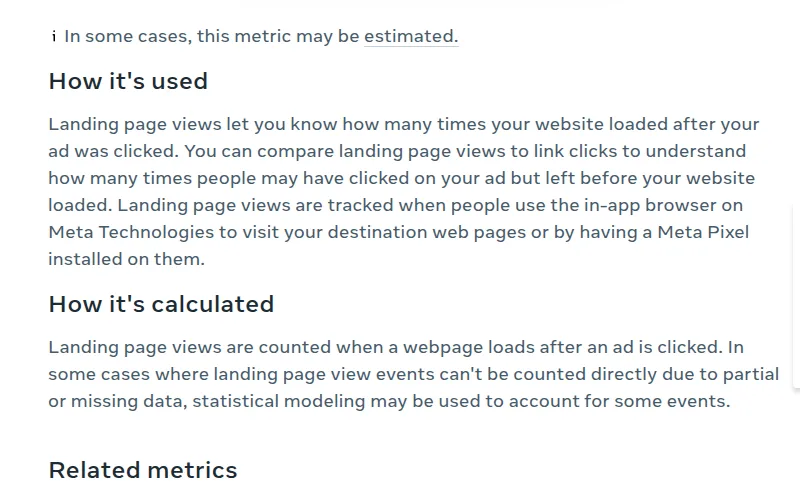
Add both columns in Ads Manager and look at the gap. If you paid for 1,000 link clicks and got 600 landing page views, 400 people never saw your page. No page change fixes that.
An agency owner who replied in the same thread started here too: "I'd treat this as a traffic quality problem before a page problem, since three different pages gave the same result."
3. Break the results down by placement
Your ad runs in many places: Facebook Feed, Instagram Stories, Reels, Audience Network and more. Results can differ a lot between them, so look at each one.
Meta's help page lays out how to see the split: "Go to Ads Manager", "Click Campaigns, Ad sets or Ads", then "Click Breakdown". The options include "Placement: View your data by the placement where your ad was shown."
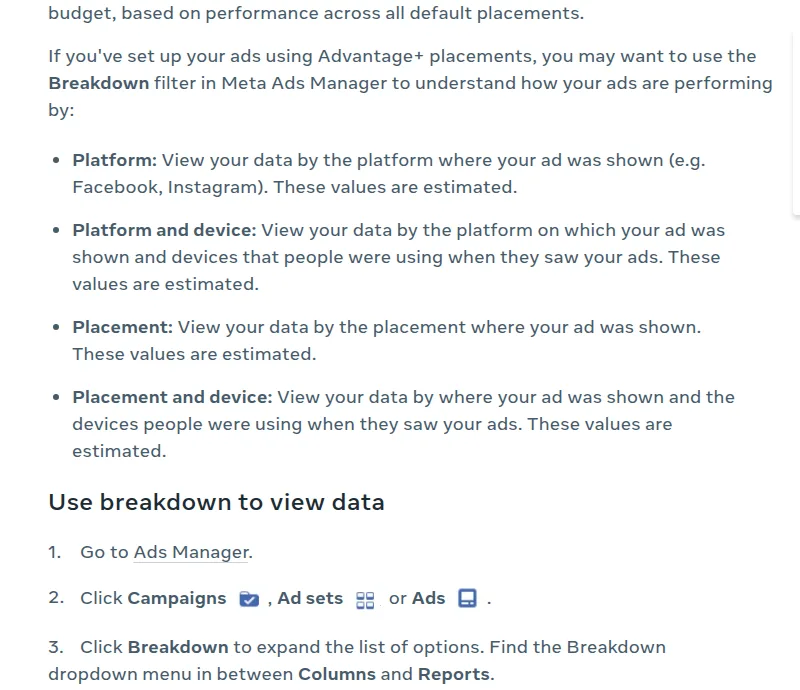
Put link clicks, landing page views and adds to cart side by side for each placement. Look for one placement with lots of clicks, few page views and no adds to cart. In the 1,000-visitor thread, three different replies told the poster to check Audience Network. That's their experience, not a rule, so check your own numbers.
One caution from Meta: it aims for the lowest cost "overall - not the lowest average cost for each placement." A placement with a higher cost per result isn't automatically the bad one. You're looking for the placement where people never reach the page or never act on it.
4. Watch the visits that never scroll
Averages hide what's going on. "5 seconds average time on page" can be a mix of real readers and visits that last less than a second.
Session recording tools let you pull out just those visits. Microsoft Clarity has a "Page scroll depth" filter to "Select data where a user scrolled an exact depth down a page", and a "Bot traffic" filter to "Select sessions detected as bots." It also has filters for rage clicks, dead clicks and "Quick backs", where "a user went to a new page then quickly returned to the previous one."
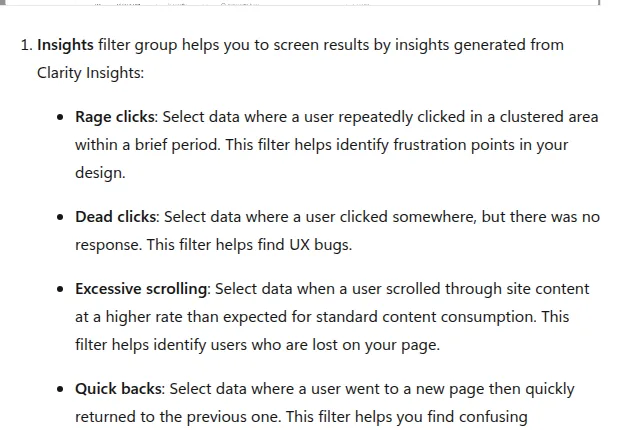
Filter for visits from your ad's campaign with almost no scroll, then watch 10 or 20 of them. One reply in the thread gave a way to sort them: "bots usually show no cursor movement at all and odd screen sizes, while people at least scroll a little." Then add the device and placement next to each one.
What you see tells you where to go next:
- Most of the zero-scroll visits come from one placement. Turn that placement off and run the same ad again.
- They're real people who read the top of the page and leave. The traffic is fine. The page is the problem, so keep going to step 5.
5. Check that the page continues the ad
If real people land and leave, the page isn't picking up where the ad stopped. The ad promised something, and the top of the page has to show that same thing. If the ad opened with a problem the reader doesn't connect to your product yet, a page in between, sometimes called a bridge page, can do that explaining before they see the product page.
Some of the posts we read this month describe three steps: the ad, then an advertorial or listicle, then the product page. They lose people at the product page. People read the advertorial, click, and land somewhere that feels like a different store. The product page should repeat four things from the advertorial:
- The promise. The main claim from the advertorial headline, in the same words, near the top.
- The product. The same pack, color and bundle the advertorial pictured. If the advertorial showed the 3-pack, open on the 3-pack.
- The proof. The review, number or guarantee the advertorial leaned on, so the reader sees it again before they pay.
- The offer. The same price and discount the advertorial named. A different price on the product page reads like a bait and switch.
Our ad-to-page message match worksheet puts the ad, the page and the page its button opens side by side, row by row.
When to call it: how many visits with zero add to carts
The second question in all these threads is how long to wait. A post in r/ecommerce had "~65 landing page views" on a $69 supplement and "None of them have added to cart or initiated checkout." Is 65 enough to know?
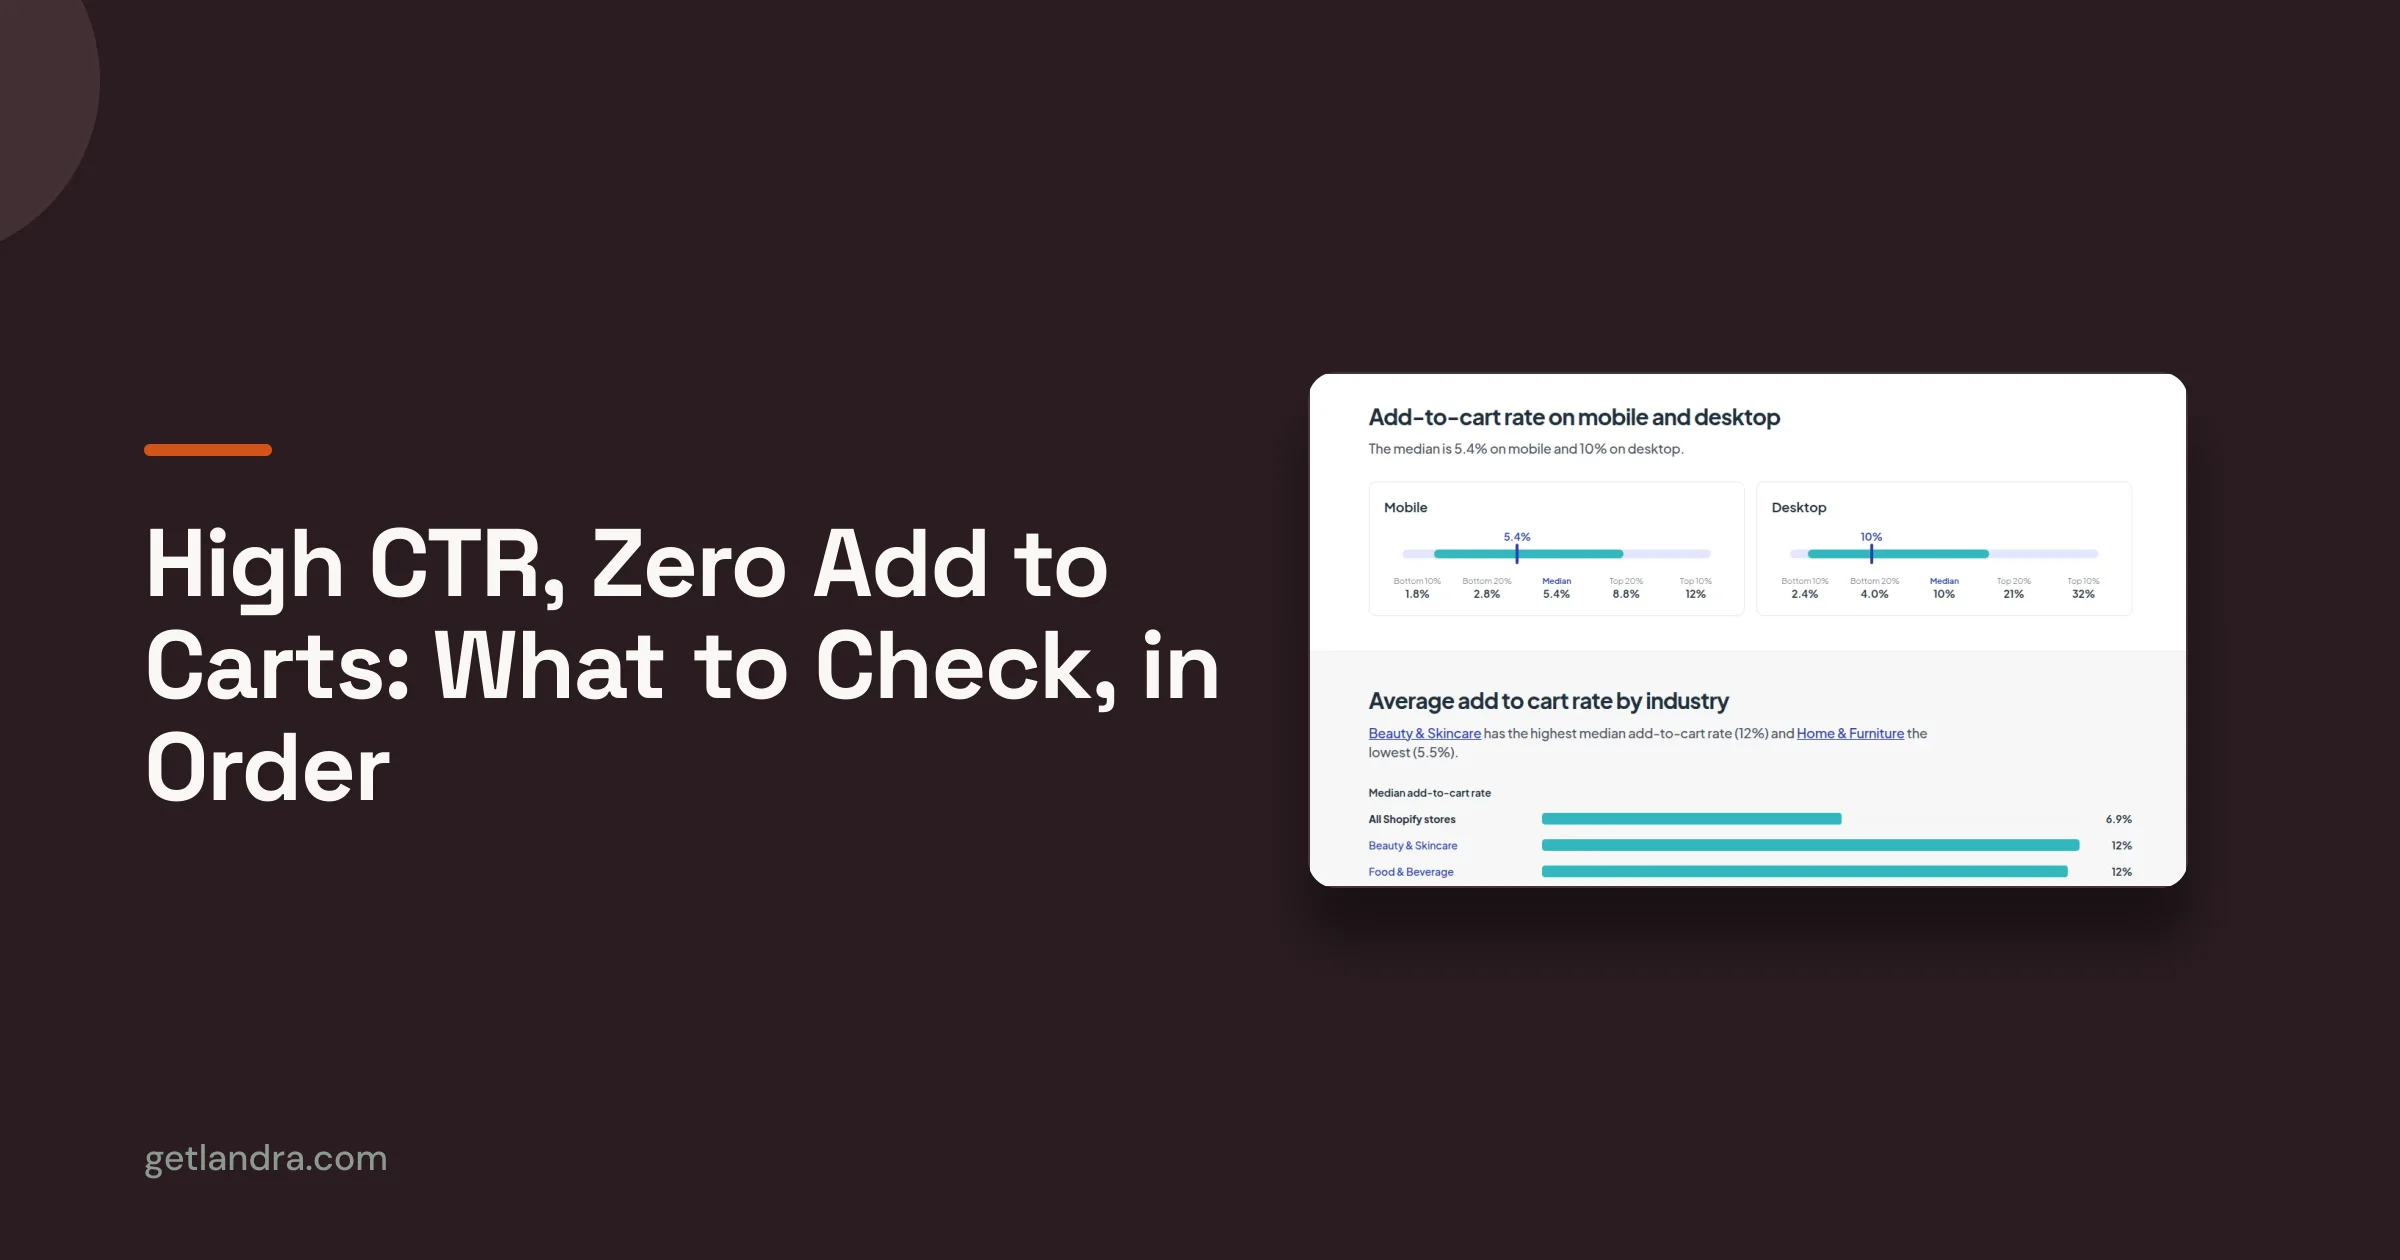
You can work it out from a benchmark. Littledata's add-to-cart benchmark (447 Shopify stores, 90 days to 7 Nov 2026) counts the share of sessions in which a product was added to the cart. On mobile, the median store is at 5.4%. The bottom 10% of stores are at 1.8%.
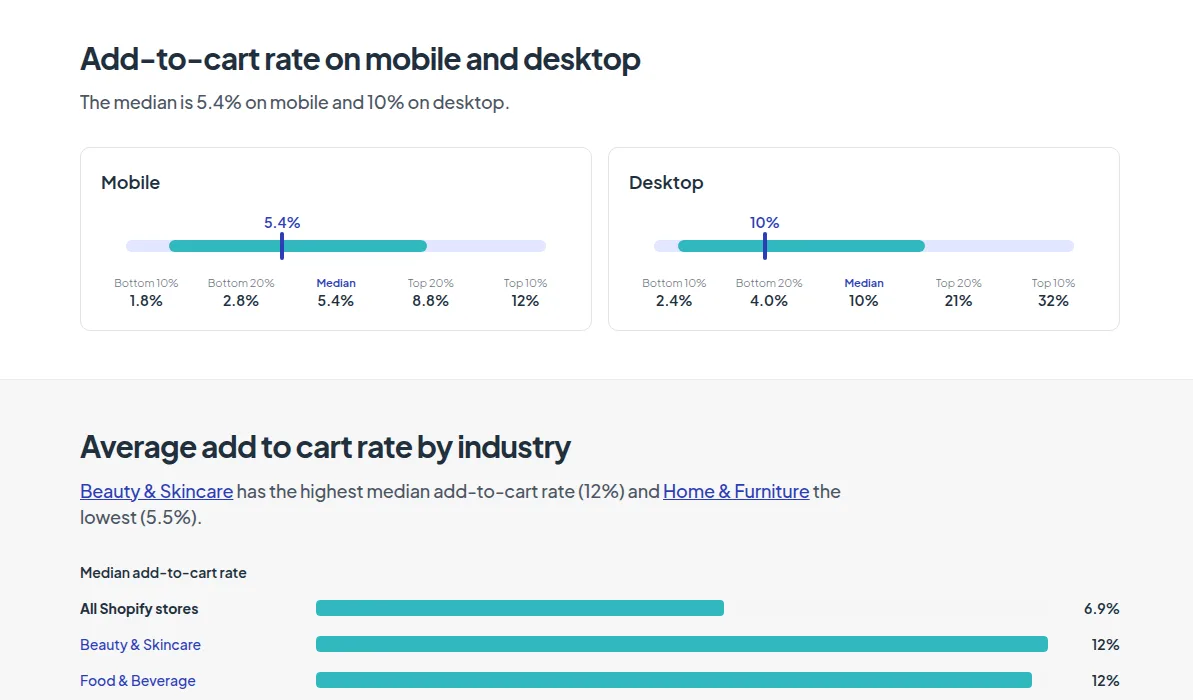
Now ask: if my page really converted at that rate, how often would I still see zero add to carts by bad luck? The rough math treats each visit as a separate coin flip:
| Real landing page views | Page at 1.8% (bottom 10%, mobile) | Page at 2.8% (bottom 20%, mobile) | Page at 5.4% (median, mobile) |
|---|---|---|---|
| 50 | 40% | 24% | 6.2% |
| 100 | 16% | 5.8% | 0.4% |
| 150 | 6.6% | 1.4% | under 0.1% |
| 200 | 2.6% | 0.3% | under 0.1% |
Once the chance falls under about 5%, zero is no longer bad luck. That's roughly 54 visits for a median mobile page, 106 for a bottom-20% page and 165 for a bottom-10% page.
So the 65-view post is enough to say the page isn't doing what a typical Shopify page does on mobile (a 2.7% chance at the median). It isn't enough to say it would do worse than the weakest stores (a 31% chance at 1.8%).
Two things to keep in mind. First, count only the views that passed steps 2 to 4, the real people. Those 1,000 visitors with 90% leaving in seconds might be 100 real visits. Second, Littledata's numbers cover all of a store's sessions, including returning visitors and email, not just people seeing your brand for the first time from an ad. New visitors from ads may add to cart less often than that, so use the bottom-10% column if most of your traffic is new. Our read: once you have 150 to 200 real visits from ads with zero add to carts, you can stop waiting and change the page.
Build the page that follows the ad
Ads are cheap and quick to make. The page is the hard part. Landra builds an advertorial or listicle from your product URL, written to continue the ad you're running (14-day trial, plans from $19/mo). We recommend checking your page to make sure we got everything right before it goes live.
Frequently asked questions
Why do I get clicks but no add to carts?
Either the clicks are not real visits (accidental taps, visits that leave before the page loads, junk placements) or real visitors land and the page does not give them a reason to buy. Compare landing page views to link clicks and break the results down by placement before you change the page.
What is the difference between link clicks and landing page views?
A link click counts the tap on your ad. Meta counts a landing page view "when a webpage loads after an ad is clicked". The gap between the two is people who clicked and left before your page loaded.
How many visitors before I know the landing page is the problem?
It depends on the add-to-cart rate you would expect. Littledata's November 2026 benchmark puts the bottom 10% of Shopify stores at 1.8% on mobile. At that rate, about 165 real visits with zero add to carts is already unlikely to be luck. At the 5.4% mobile median, about 54 is enough.
Is it bots or my landing page?
Look at the visits, not the average. Filter your session recordings for visits with almost no scroll and watch a few. If they come from one placement, exclude it. If they are real people who read the top of the page and leave, the page is the problem.
Should I lower my price if nobody adds to cart?
Not first. If nobody adds to cart at all, people are leaving before the price matters. Rule out tracking, junk clicks and a page that does not match the ad, then test the offer.