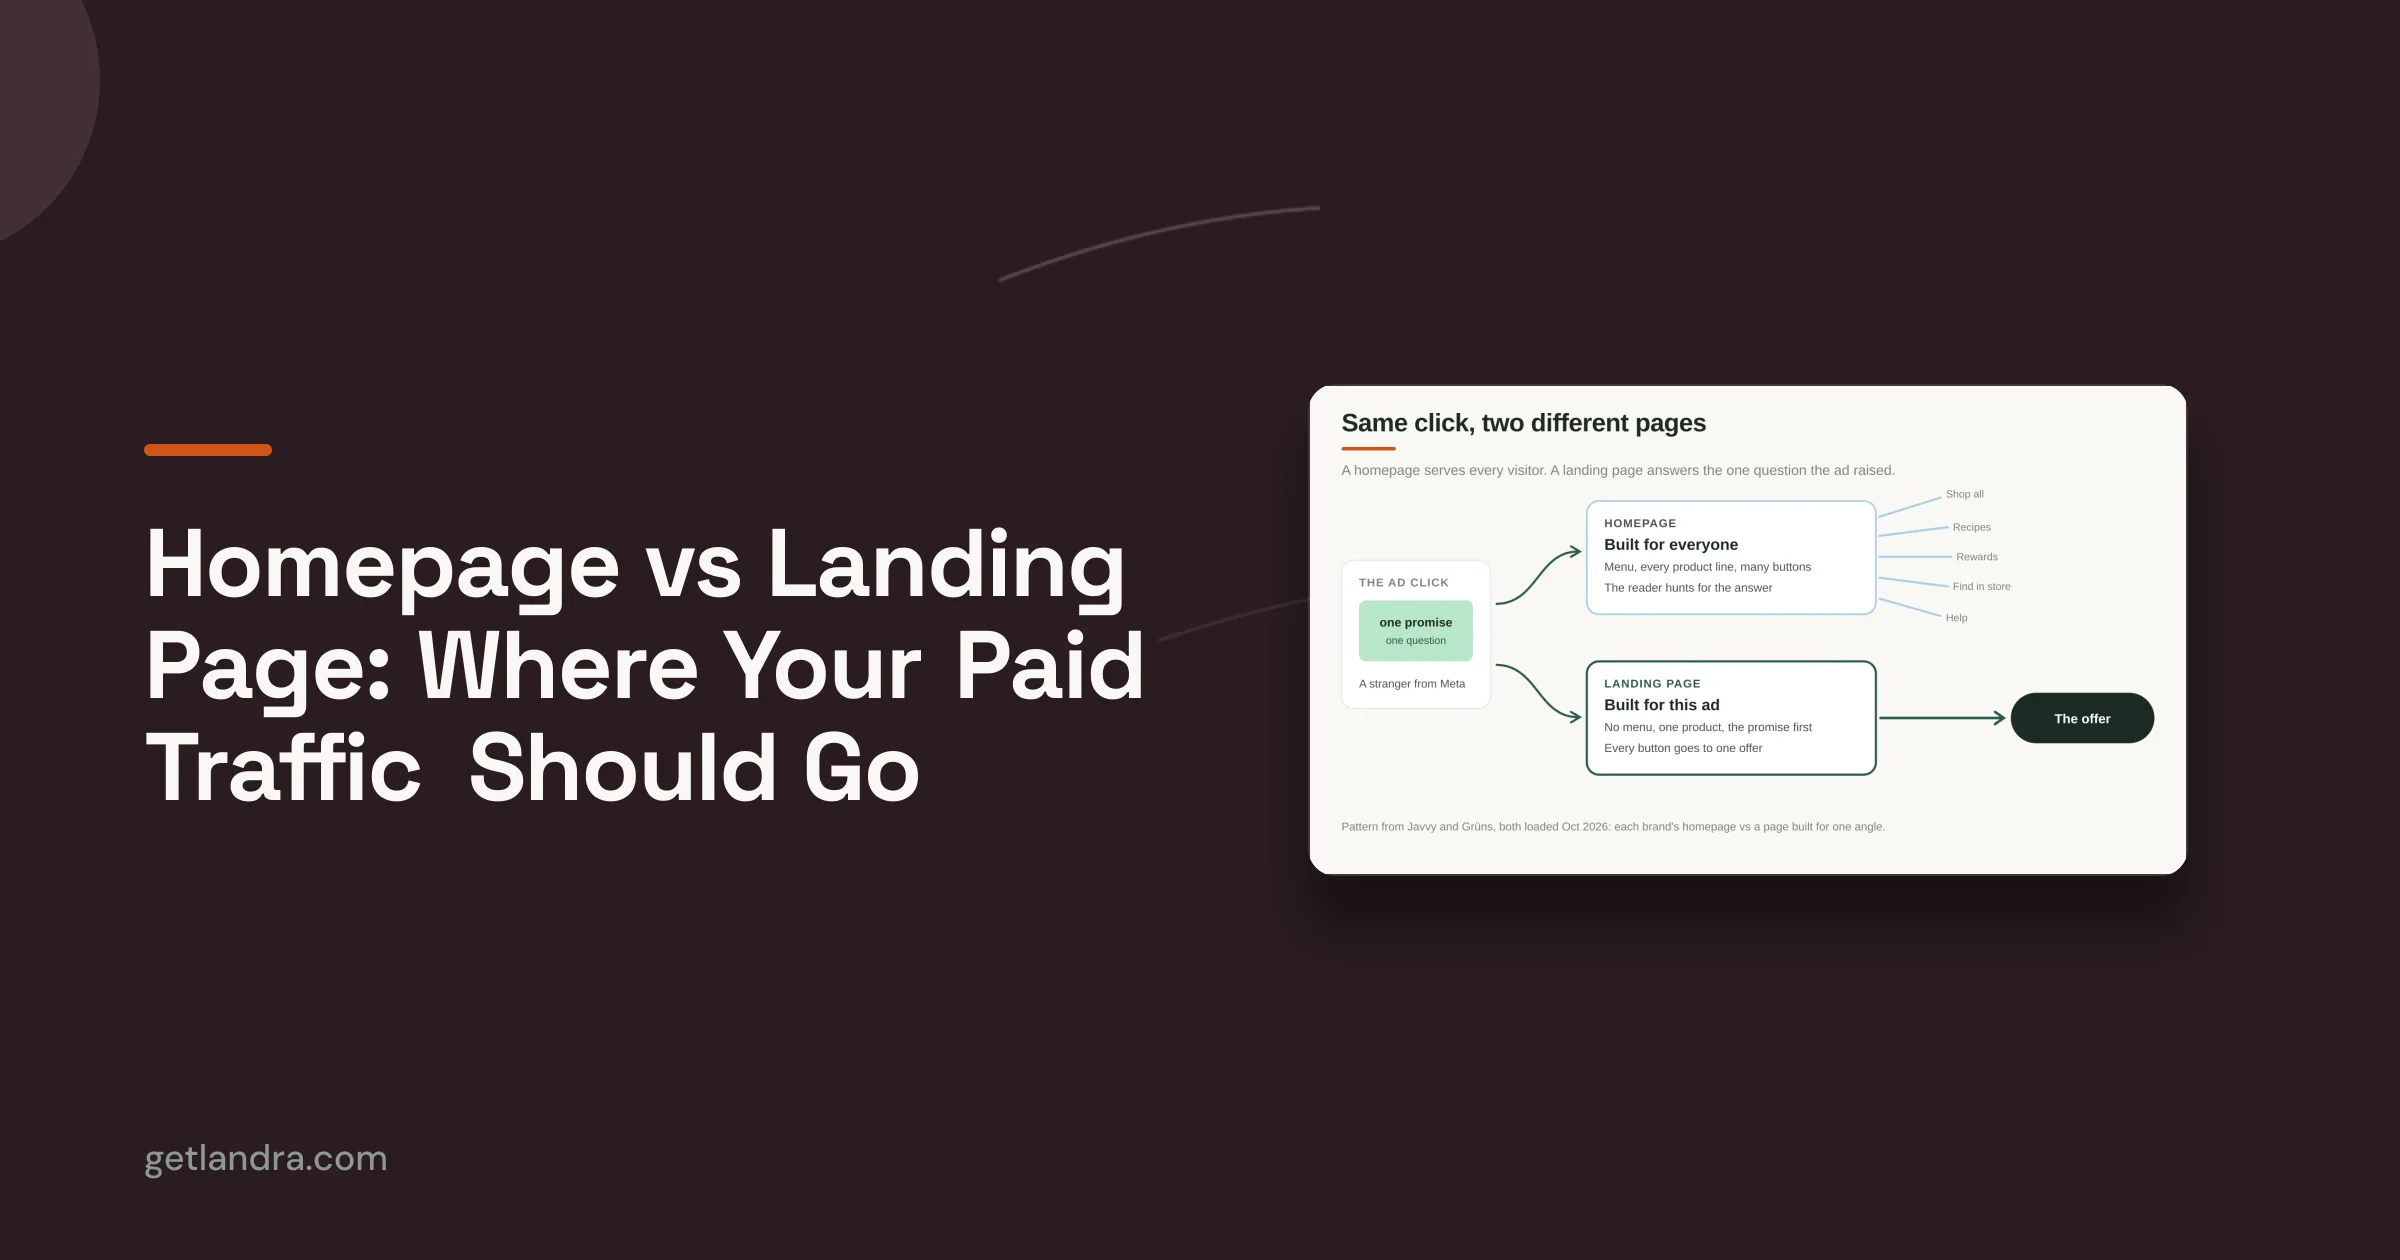


You've seen the dashboard. Spend is up, clicks look healthy, and sales don't match the traffic. The first instinct is to ask a simple question: what's my conversion rate? The problem is that the raw percentage rarely answers the core question, which is whether your paid social traffic is working or whether your landing experience is wasting budget.
That's where a conversion rate calculator helps, but only if you treat it as a diagnostic tool. For DTC brands running Meta and TikTok, the calculation matters less than the interpretation. A low rate on cold traffic doesn't automatically mean the product is weak. It often means the page is asking for a purchase before the visitor has enough context, trust, or desire to buy.
Often, analysis concludes with just the formula. Practitioners can't afford to. You need the math, the benchmark, the sample-size reality, and a clear next move when cold traffic under-converts.
Table of Contents
- Your Calculator Is a Starting Point Not a Final Grade
- How to Calculate Your Conversion Rate The Right Way
- Statistical Significance for Marketers
- Is Your Conversion Rate Good E-commerce Benchmarks for 2026
- Using Landra's Free Conversion Rate Calculator
- Your Rate Is Low Now What
- From Calculation to a Full CRO Workflow
Your Calculator Is a Starting Point Not a Final Grade
A conversion rate calculator gives you a number. It does not give you judgment.
A DTC marketer can look at the same outcome and reach three different conclusions. One person sees underperformance. Another sees a page problem. A third sees a traffic quality issue. The calculator itself can't tell you which one is true.
That matters most with paid social because cold traffic behaves differently from returning visitors, branded search, or email traffic. If you blend everything together, the percentage looks neat and the decision behind it gets sloppy. You end up reacting to an average instead of understanding a funnel.
Why the percentage alone misleads
A single sitewide conversion rate hides the fundamental question: which audience, on which page, from which channel, converted at what rate?
If you send cold Meta traffic straight to a Shopify product page, you're asking for a purchase from people who often still need the basic sales argument. They haven't read the reviews yet. They don't know why the offer is different. They may not even fully understand the problem-solution framing from the ad.
Most bad conversion decisions come from treating blended traffic like a single audience.
The calculator is useful when it helps you isolate a slice of traffic and ask whether that slice is healthy. It's much less useful when it becomes a vanity metric on a reporting deck.
What practitioners actually need from the number
The useful version of conversion rate analysis does three things:
- Sets a baseline: You need a clean starting point before changing creative, offer, landing page, or checkout flow.
- Locates friction: A weak result from one campaign or one landing page tells you where to inspect the ad-to-page handoff.
- Supports the next test: The metric should push you toward a decision, not just a reaction.
If the result is low, don't jump straight to “the product doesn't work.” In DTC, that's often the laziest explanation available. More often, the offer is being introduced on the wrong page, in the wrong sequence, to the wrong awareness level.
How to Calculate Your Conversion Rate The Right Way
You launch a cold Meta campaign, see traffic coming in, and open the dashboard expecting a clean answer. Instead, you get a conversion rate that looks precise and explains almost nothing. That usually happens because the math is easy, but the setup is sloppy.
Start with the core formula
Conversion rate is (Conversions ÷ Total Visitors) × 100.
If 2,000 visitors land on a page and 40 of them buy, the conversion rate is 2%.
The formula is basic. The actual work is deciding what counts as a visitor, what counts as a conversion, and which slice of traffic deserves analysis in the first place.

Define the denominator before you trust the result
A bad denominator wrecks the whole calculation.
Teams often mix sessions from one tool, users from another, and pageviews from a third, then compare the output as if it reflects one stable system. It does not. If the denominator changes, the rate changes, and the comparison stops being useful.
Use this check before you report anything:
| Input | What to decide | Why it matters |
|---|---|---|
| Visitors | Unique users or sessions | One buyer can generate multiple sessions, which changes the rate materially |
| Conversion | Purchase, lead, add-to-cart, or sign-up | Each event answers a different business question |
| Scope | Sitewide, campaign landing page, or product page | Broad reporting hides where paid traffic is losing momentum |
For DTC paid social, the cleanest starting point is usually the landing page tied to the campaign. A sitewide purchase rate blends returning customers, branded traffic, email, and paid clicks into one number. That may help with executive reporting. It rarely helps diagnose why cold traffic from Meta is stalling.
Match the conversion event to the decision you need to make
Many teams often become complacent. They use purchase conversion rate for every question, even when the page is not meant to close the sale on first touch.
If you are testing a pre-sell page, the first question is often whether it improves the handoff from ad click to product interest. In that setup, click-through to product page, add-to-cart rate, and final purchase rate can all matter. They just should not be blended into one reading.
Use one primary conversion for one decision.
A clean setup usually looks like this:
- Start with the business question. Example: can this page warm cold paid traffic enough to improve purchase intent?
- Choose the conversion that matches that question. If the goal is to measure buying outcomes, use purchase. If the goal is to measure whether the pre-sell is doing its job, use the next meaningful step.
- Keep the denominator consistent. Do not switch from users to sessions between reporting periods.
- Segment traffic before comparing rates. Cold paid social should be evaluated separately from branded, email, and returning visitors.
That discipline matters because DTC brands often blame the offer when the real issue is sequencing. Cold traffic that does not convert on a product page may still convert after a stronger pre-sell experience. The calculator helps surface that problem. It does not solve it on its own.
Practical rule: a conversion rate only means something when the traffic source, page type, and conversion event are defined with precision.
That is the right way to calculate it. You are not chasing a prettier percentage. You are trying to find where CAC is being created, or wasted.
Statistical Significance for Marketers
Two campaigns can show the same conversion rate and still carry very different levels of confidence.
The same rate can mean different things
A conversion rate calculator that only outputs one percentage encourages overconfidence. Marketers see a result, compare it to another result, and assume the higher number won. That's not how testing works.
A low-volume result can swing hard from a few extra conversions. A high-volume result is more stable. That's why a rate from a small sample shouldn't trigger aggressive decisions on its own.
If one page gets a small trickle of traffic and converts a handful of people, the observed rate may be directionally interesting, but it still might move a lot as more visitors arrive. If another page gets a much larger sample and lands at the same percentage, that result is usually more trustworthy.
Why better calculators use Wilson intervals
Most free tools fall short. They do the arithmetic and skip the reliability layer.
A more rigorous calculator should use the Wilson score interval rather than the Wald formula for confidence intervals, because the Wilson method stays reliable across sample sizes and avoids the zero-conversion edge cases that distort low-volume tests, as explained by MiniWebTool's conversion rate calculator methodology.
That matters in DTC because early-stage tests on advertorials, listicles, and fresh campaign variants often start with thin traffic and sparse conversions. If the calculator handles those conditions badly, you can kill a viable page too early or back a weak variant because the first few conversions happened to land there.
What to do with significance in practice
You don't need to turn into a statistician. You do need to stop treating every early result like a final answer.
Use this operating logic:
- If volume is thin: treat the result as directional, not conclusive.
- If a variant shows zero or near-zero conversions early: don't assume the page is dead without checking whether the sample is still too small.
- If one version appears slightly ahead: ask whether the gap is meaningful enough to act on.
A serious paid social team doesn't just ask “which page has the higher conversion rate?” It asks “is the difference stable enough to reallocate spend?”
A single percentage is a snapshot. Confidence tells you how much weight that snapshot deserves.
The practical value of a conversion rate calculator goes up when it helps you avoid false certainty. That's especially important when the page you're testing is designed to warm cold traffic. Those pages often need enough visits to show their real effect.
Is Your Conversion Rate Good E-commerce Benchmarks for 2026
A founder looks at a 1.7% store conversion rate and asks the wrong question. “Is this good?” usually sounds useful, but for a DTC brand buying cold traffic on Meta or TikTok, it hides the underlying issue. The better question is whether that rate can support CAC at your current click costs, and where the drop is happening.
What counts as good depends on what you sell and who you're buying
Across industries, e-commerce conversion rates tend to cluster around a fairly modest middle. Category context still matters. Fashion stores usually behave differently from electronics brands, and both behave differently from a supplement brand pushing impulse-friendly bundles.
That is why broad averages help only at the start. Conversion Bench's industry comparison is useful for setting rough category expectations, but paid social teams should not treat a sitewide benchmark as a campaign benchmark.

Cold traffic changes the standard. A returning customer landing on a product page after branded search is solving a different job than a first-time visitor who clicked a curiosity-driven social ad. If you want a more relevant reference point, review these DTC landing page conversion benchmarks for 2026, especially if you are comparing product pages against advertorials, quiz funnels, or pre-sell pages.
Device mix changes the benchmark faster than most teams expect
For paid social, mobile is usually the primary benchmark. That alone can pull your blended conversion rate down even when desktop performance looks healthy.
As noted earlier, benchmark summaries consistently show a wide gap between desktop and mobile purchase behavior. That gap matters less as trivia and more as diagnosis. If desktop converts acceptably and mobile does not, the problem often sits in the experience itself. Slow load times, cluttered first screens, weak message match, buried proof, and awkward add-to-cart flow can all suppress mobile conversion before the product gets a fair shot.
Teams often misread the number. They blame the offer, cut spend, or swap creative, when the page is doing a poor job of warming skeptical traffic on a small screen.
Use benchmarks in the same order you use funnel math:
- Start with category. It sets a rough outer range.
- Check device mix. A mobile-heavy blend will behave differently from a desktop-skewed store.
- Split by traffic intent. Cold paid social should not be judged against email, branded search, or returning users.
- Compare page types. A product detail page and a pre-sell landing page should not be held to the same standard if they are doing different jobs.
Benchmarks are useful only if they lead to a better decision
A benchmark should tell you what to inspect next.
If your overall store rate looks average but cold paid social campaigns underperform, the store average is not your answer. If product pages convert weakly for first-click traffic, that does not always mean the brand has a product problem. It often means the landing experience is asking for purchase before the visitor has enough belief.
That is why the calculator is not the endpoint. It gives you a clean read on underperformance, then helps you justify the next move. In many DTC accounts, that move is a pre-sell page that handles education, objection control, and proof before the click reaches the product page.
A “good” conversion rate is the one that works with your CPCs, margin structure, and funnel design. Benchmarks help frame that judgment. They do not replace it.
Using Landra's Free Conversion Rate Calculator
If you need a clean baseline fast, use a calculator that does one job clearly. Enter visitors, enter conversions, and get the percentage without adding reporting noise.
What to enter and what to ignore
The free conversion rate calculator from Landra is straightforward for this first pass. Put in your total visitors for the page or traffic segment you want to evaluate, then enter the number of conversions tied to that same slice.

The important part isn't the interface. It's input discipline.
Don't mix a landing page's visitors with whole-store purchases. Don't use all-site traffic if you're trying to evaluate one campaign. Don't combine warm returning traffic with first-click paid social if your actual problem is cold acquisition efficiency.
How to use the result in a real workflow
A simple calculator is most useful at the start of analysis, not the end. I'd use it in this order:
- Pull one segment. Example: cold Meta traffic to one page.
- Calculate the baseline.
- Compare the result to your expected range for that page type and traffic intent.
- Decide what to inspect next.
If the number looks weak, the right response is usually to inspect page-message fit before touching ad spend. If it looks healthy, then you can move down the funnel and check cart, checkout, or offer structure.
What works well here is speed. You don't need to open a full analytics workspace just to sanity-check whether a campaign landing page is converting at a level worth deeper investigation. The calculator gives you the first read. The diagnosis still depends on how well you segment the data.
Your Rate Is Low Now What
A low conversion rate is not a verdict. It's a clue.

The usual problem is message-to-page mismatch
For cold paid social, the failure point is often the jump from ad to page. The ad creates curiosity, highlights a problem, or introduces a promise. Then the click lands on a product page built for someone much closer to purchase.
That jump is where under-conversion starts.
The issue usually isn't that people refuse to buy online. It's that the page sequence is wrong for their awareness level. Product detail pages are built to answer purchase questions. Cold traffic often arrives with pre-purchase questions.
Here's the harder truth. Sitewide averages make this easy to miss. A store can look acceptable overall while cold campaign traffic struggles because high-intent branded visitors and returning customers lift the blended rate.
Why pre-sell pages change the economics
Dedicated pre-sell pages perform better in this context because they continue the sales argument instead of ending it. They explain. They frame. They handle objections. They create narrative continuity from ad click to product offer.
According to Bizeract's conversion rate calculator guide for DTC e-commerce, dedicated pre-sell pages such as advertorials and listicles consistently achieve 2 to 3 times higher conversion rates than standard PDPs, and routing paid social traffic to a pre-sell page rather than a PDP can reduce CAC by about 46%.
That doesn't mean every brand should replace every product page. It means cold traffic often needs a different page type than warm traffic.
A pre-sell page usually works when it does a few things well:
- Matches the ad promise: The opening should feel like the click was fulfilled, not redirected into a catalog.
- Builds buying context: Cold visitors need explanation before comparison-shopping mode takes over.
- Controls attention: Fewer navigation exits and fewer competing choices keep the session focused.
- Moves naturally to product: The handoff to the offer should feel earned, not abrupt.
This walkthrough is worth watching if you're evaluating that approach in practice.
When cold traffic under-converts, don't ask only whether the ad is bad. Ask whether the landing page is trying to close before it has sold.
What tends to work and what usually fails
A few patterns show up repeatedly in DTC funnels.
| Usually works | Usually fails |
|---|---|
| Ad angle carried into a narrative landing page | Ad angle dropped into a generic PDP |
| Mobile-first pages with tight message flow | Dense pages that force pinching, scanning, and guessing |
| One clear next action | Multiple competing routes and distractions |
| Education before checkout pressure | Checkout pressure before belief is built |
If your conversion rate calculator gives you a weak number on cold traffic, that's often the moment to change the page type, not just the bid strategy.
From Calculation to a Full CRO Workflow
A conversion rate calculator is useful when it becomes part of a repeatable operating system.
A practical operating rhythm
Calculating conversion rate often occurs after a campaign underperforms. Better teams calculate it before making every meaningful funnel decision.
A practical workflow looks like this:
- Measure by segment: Calculate at the landing-page and channel level, not only sitewide.
- Pressure-test the result: Make sure the reading is stable enough to support a decision.
- Benchmark with context: Compare against a relevant category, device mix, and funnel stage.
- Diagnose the gap: If cold traffic is weak, inspect the ad-to-page transition first.
- Launch a page hypothesis: Test a different landing experience, angle, or sequence.
- Repeat with discipline: Recalculate on the new variant and keep the loop moving.
What disciplined teams do differently
A lot of bad optimization starts with attribution sloppiness. As noted by Grow Conversions on calculating conversion rate for DTC, most conversion rate calculators ignore channel-specific attribution misalignment, and 68% of DTC brands misattribute conversion success because they use sitewide averages instead of landing-page-specific CVR.
That's why a broader conversion rate optimization workflow matters more than the calculator itself. The calculator gives you the reading. The workflow tells you what to do with it.
The brands that improve fastest don't obsess over one magic benchmark. They get stricter about segmentation, clearer about intent, and faster at testing the page experience that sits between ad click and product page.
If you remember one thing, make it this: the number is not the answer. The number tells you where to look.
If you want to turn that diagnosis into a page test, Landra generates editable pre-sell pages such as advertorials and listicles from a product URL, giving DTC teams a faster way to test the landing experience between cold paid social traffic and checkout.