A 55-inch TV and a bag of mushroom coffee do not convert at the same rate, and no honest benchmark pretends they do. So when someone quotes you "the average conversion rate is 2%," ask which 2% — a number blended across electronics, jewelry, supplements, and apparel describes none of them. The fix isn't to redefine conversion into something flattering. It's to measure it the way the whole industry measures it, compare it against your own vertical, and then treat every benchmark as a number to beat. Below is the sourced, dated stat-pack for advertorials, listicles, and DTC pre-sell pages — and, at the end, the figures we deliberately left out, with the reason for each.
Note on companion data: this hub covers the page-type, reading-behavior, and funnel statistics behind pre-sell pages. For the full segmented lookup tables — conversion rate by industry, by traffic source, and by device — see our DTC landing page conversion benchmarks, which owns that cut. This page adds what those tables don't.
Measure conversion rate one standard way
The industry-standard metric is purchase conversion rate: completed orders divided by sessions. Measure it that one way, consistently, and don't get fooled by a number that counted something else. The single most-misquoted stat in DTC is the 6.6% "landing page" median — that's Unbounce's all-industry figure for landing-page actions like form fills and signups (2024 data, vendor), not ecommerce purchases.
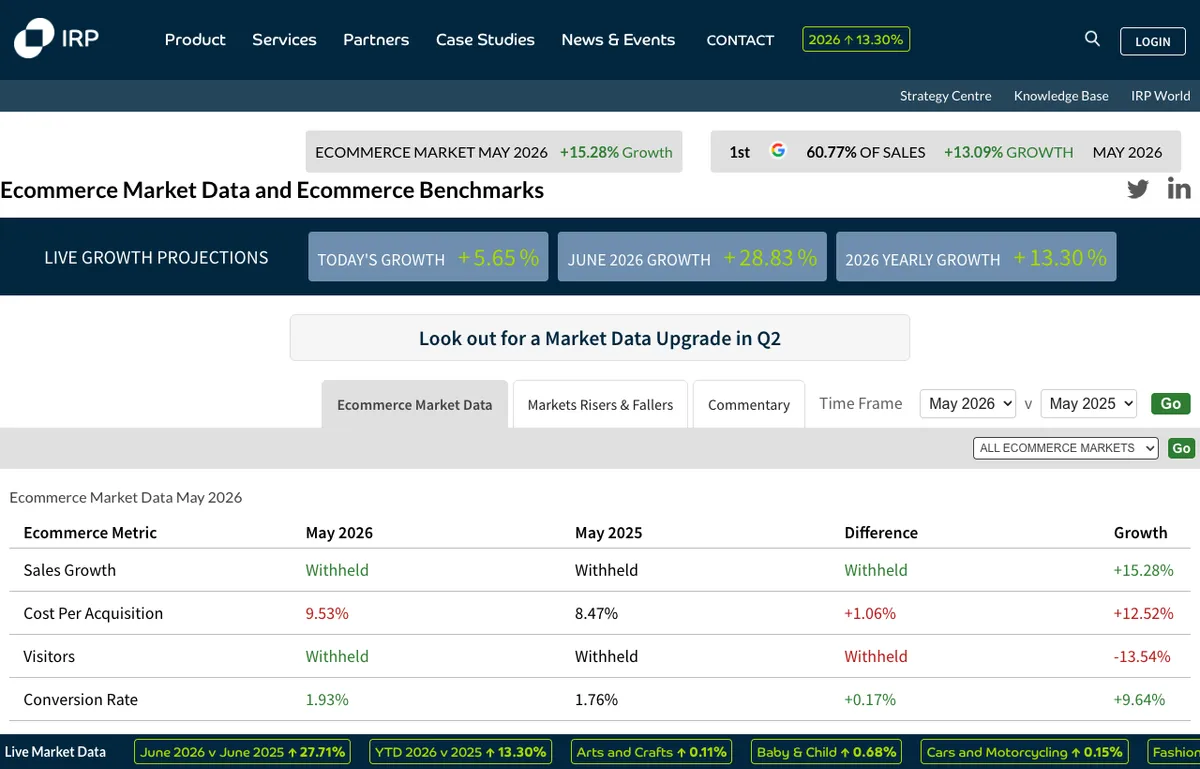
For real purchase conversion, the current anchor is 1.93%, the overall ecommerce conversion rate in May 2026 from IRP Commerce's live transaction data — up from 1.76% a year earlier (May 2025). A second read: Triple Whale reported a 2.01% median across 33,000+ brands (February 2026, vendor data). Both describe purchases, and both sit far below the 6.6% form-fill figure.
| Statistic | Figure | What it measures | Source (date) |
|---|---|---|---|
| Ecommerce purchase CVR | 1.93% | Completed orders / sessions, live network data | IRP Commerce (May 2026) |
| Ecommerce median CVR | 2.01% | Median purchase rate, 33,000+ brands | Triple Whale (Feb 2026, vendor) |
| All-industry landing-page median | 6.6% | Any landing-page action (form fills, signups) | Unbounce (2024, vendor) |
| Ecommerce landing-page median | 4.2% | Landing-page actions, ecommerce vertical | Unbounce (2024, vendor) |
The trap is comparing your purchase rate against a form-fill median and concluding you're failing. You're not — you're comparing two different events. Pick the metric, hold it constant, and the only thing left changing is your page.
Benchmark against your own vertical, not a blended average
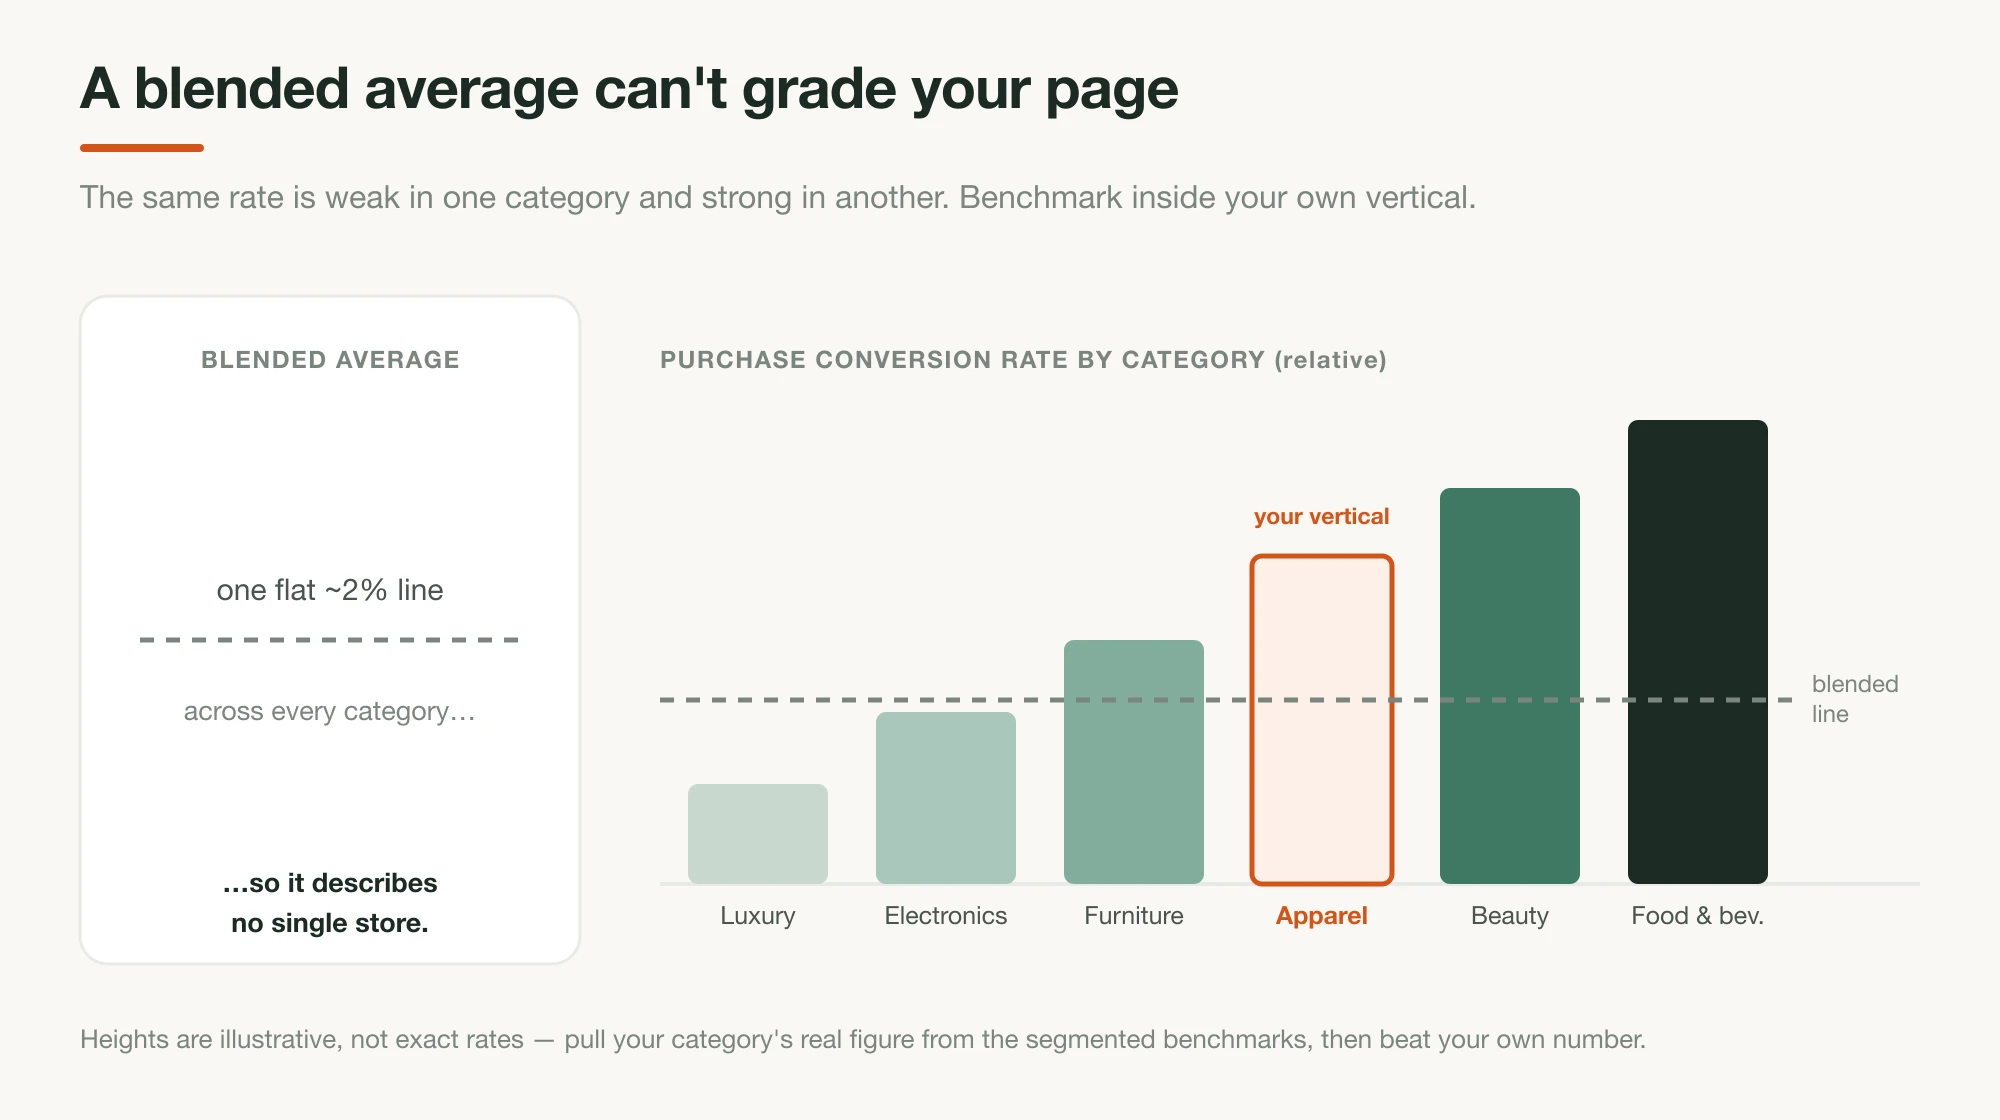
A blended cross-industry average is close to useless for judging your page, because conversion rate varies several-fold by category. Food, beverage, and consumable supplements convert highest; furniture, electronics, and luxury convert lowest. "Average" only means something inside your vertical — which is why the segmented tables matter more than any single headline number.
We keep the full by-industry, by-traffic-source, and by-device cuts in one place rather than duplicating them here. The short version: pull your category's number and your traffic source's number before you judge a page, because the same 1.2% can be weak in one vertical and completely normal in another.
For the verified figures — category-by-category, source-by-source, mobile vs desktop — see the DTC conversion benchmarks hub. Treat whatever you find there as a starting line, not a finish.
The only number that matters is your own — then beat it
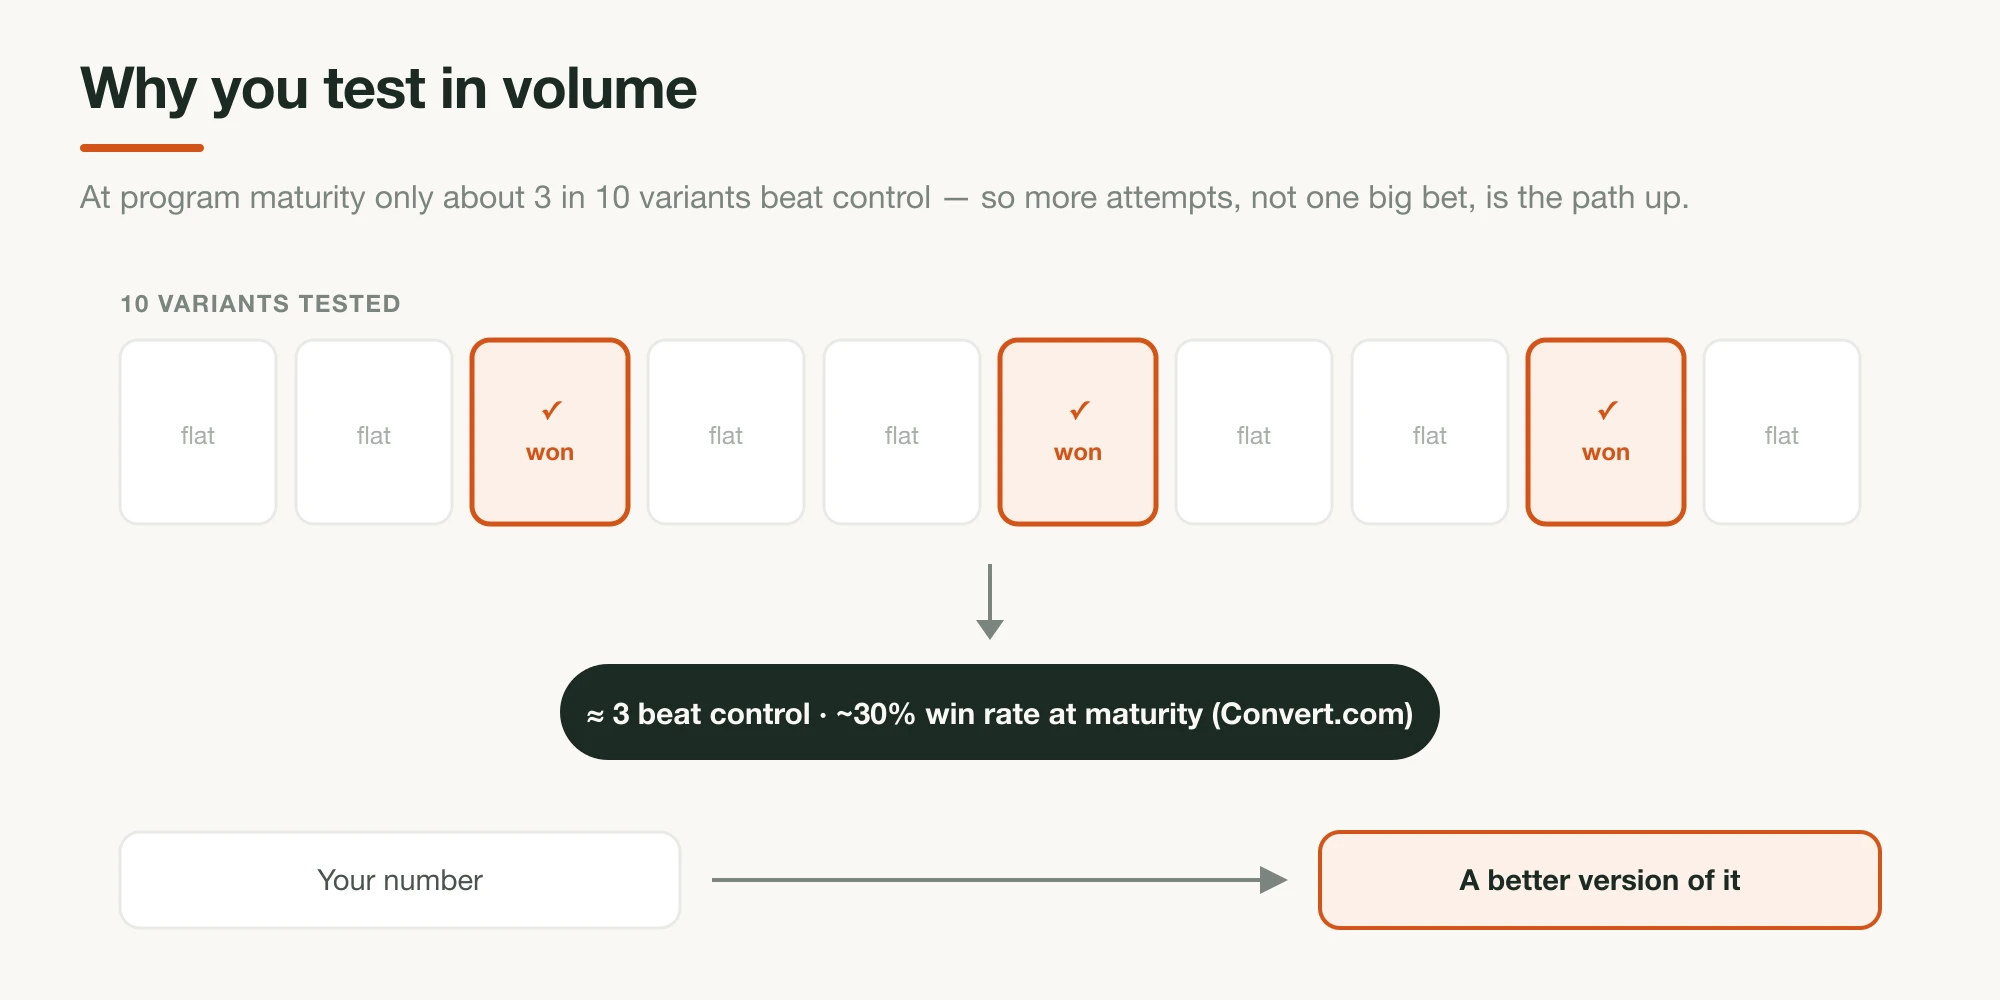
Benchmarks tell you roughly where the floor is; they never tell you where you should land. The number that actually matters is your own conversion rate, tracked one consistent way, improving month over month — this month's page against last month's, not against a stranger's dataset. And the way you move it is by testing, because you will not guess your way to a winner.
The reason you run many variants instead of betting on one: even at program maturity, roughly 30% of A/B tests win (a 10–50% range, with the higher end early when easy wins are still on the table), per Convert.com's aggregation of test-program data (read as reported). If two in three of your tests don't beat control, the only path to a higher number is volume of attempts — and the cheapest attempts are page-level, where one build can vary the angle, the open, and the offer at once.
Warm the cold click before you sell it
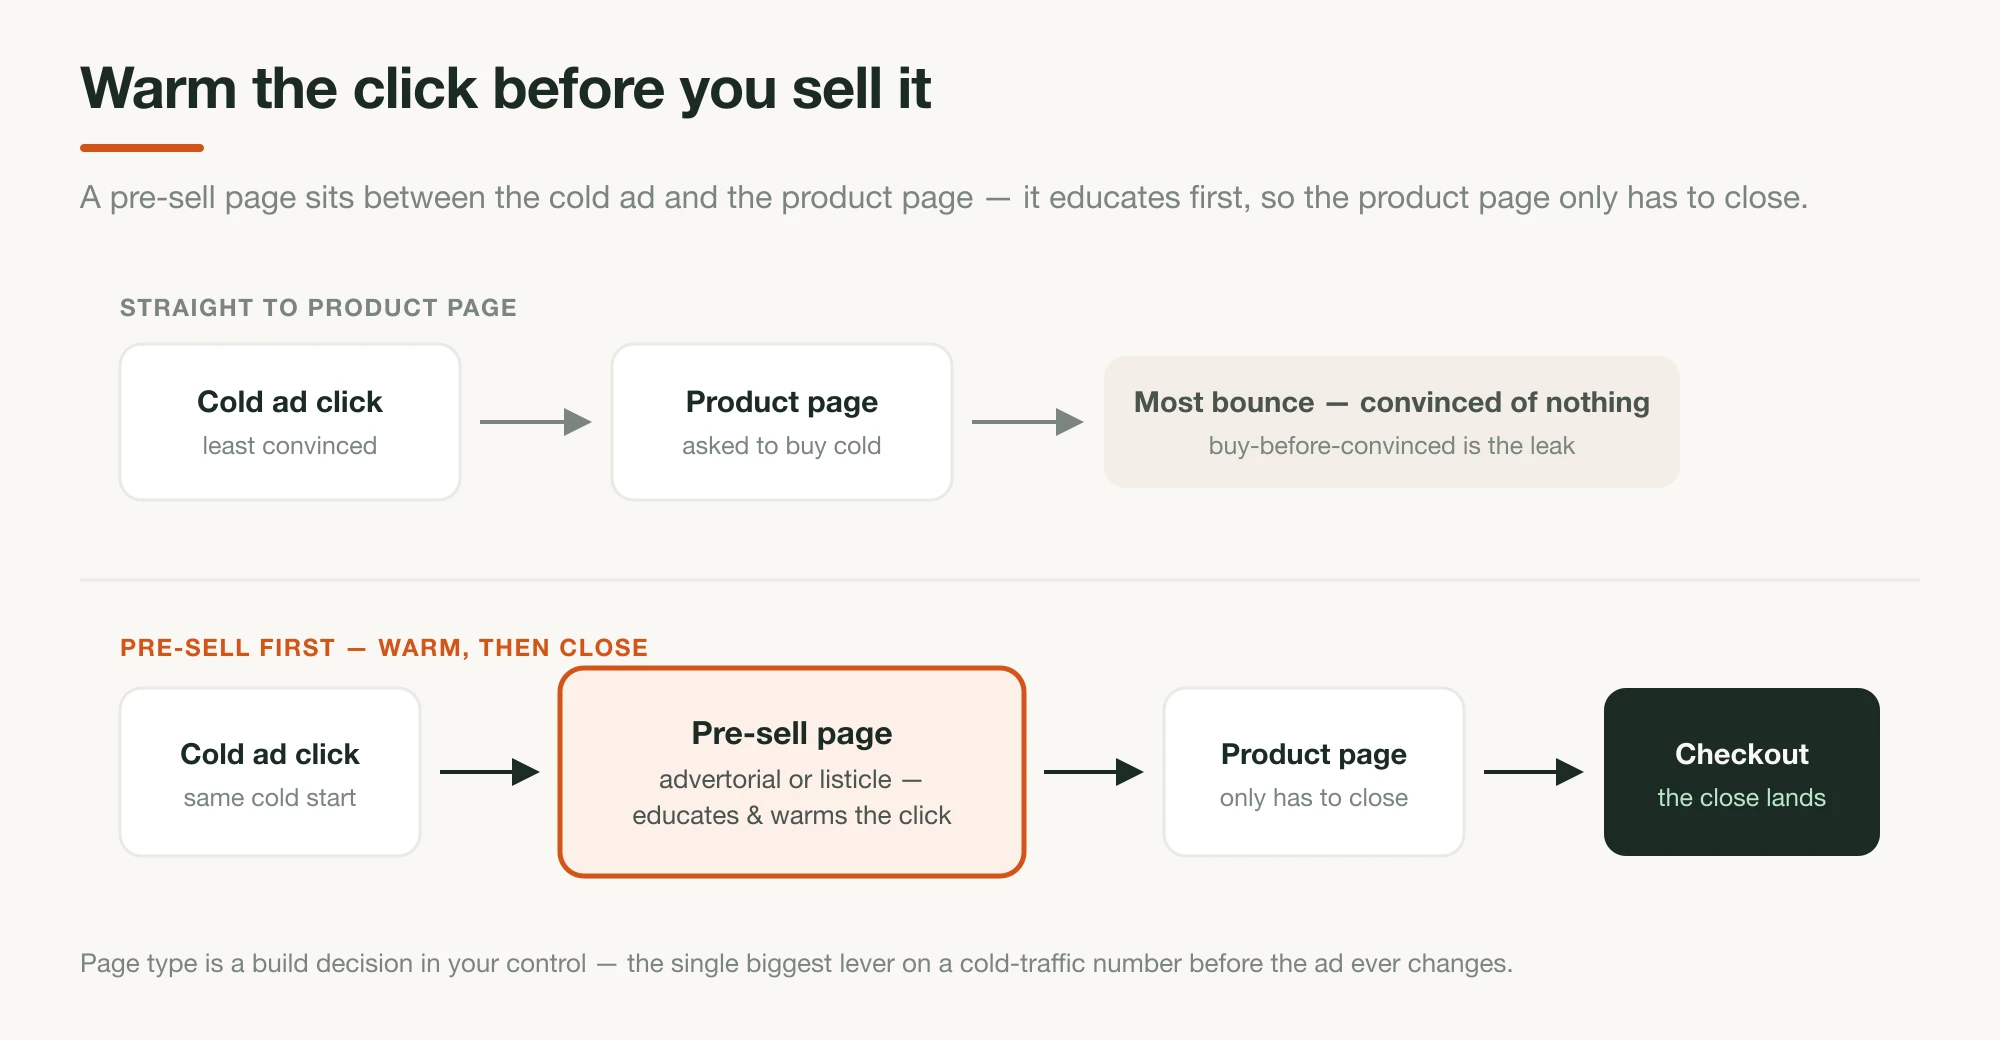
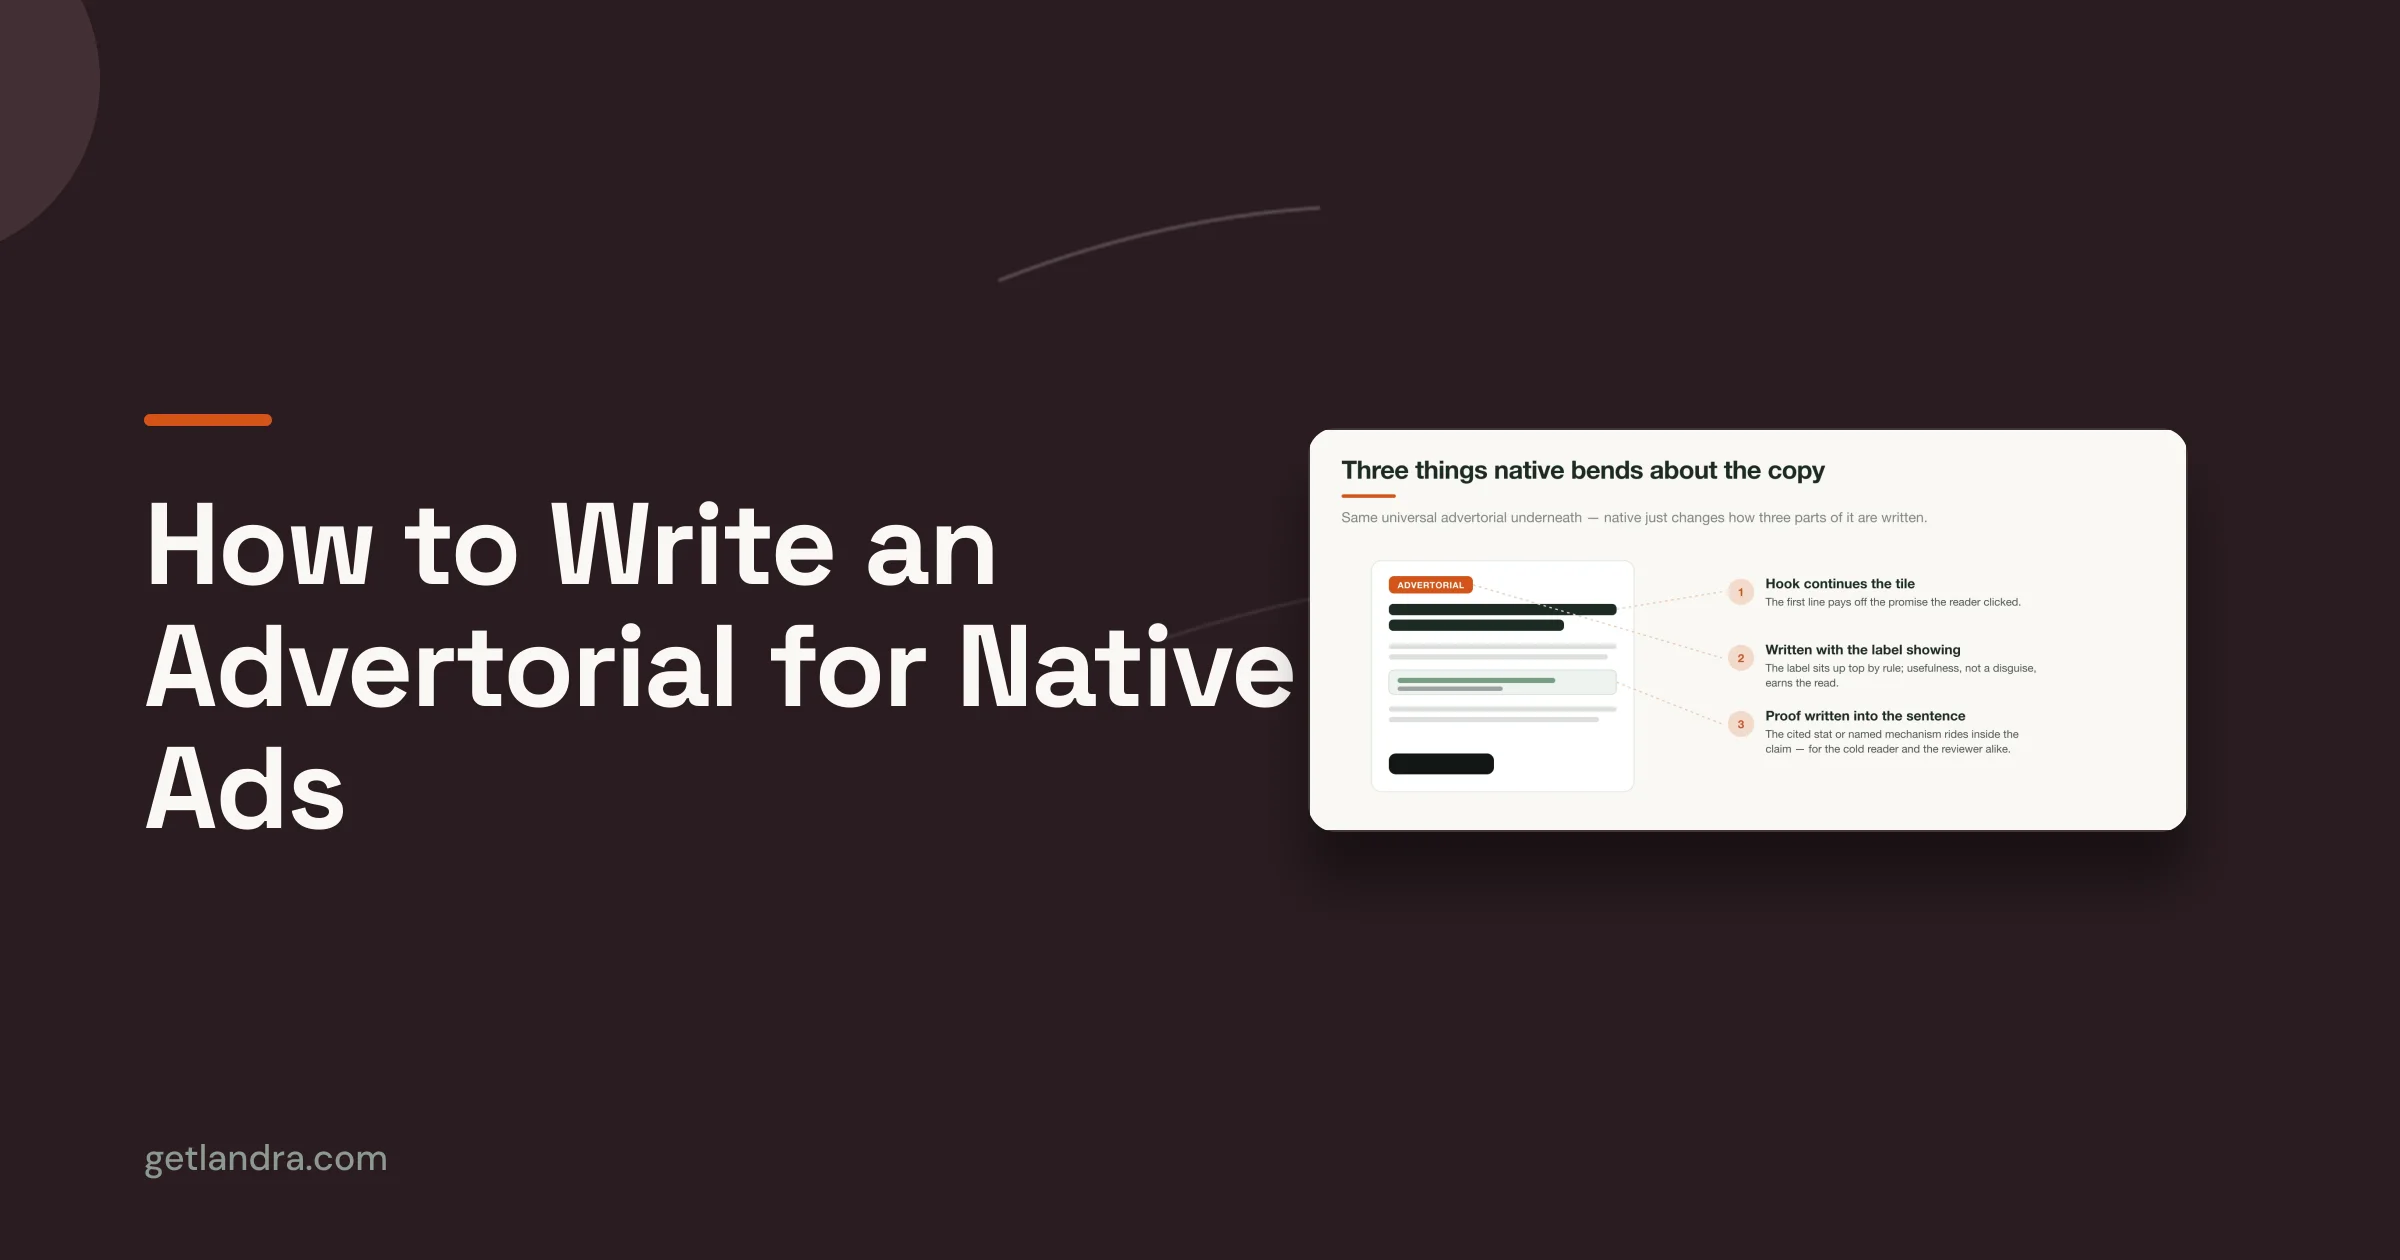
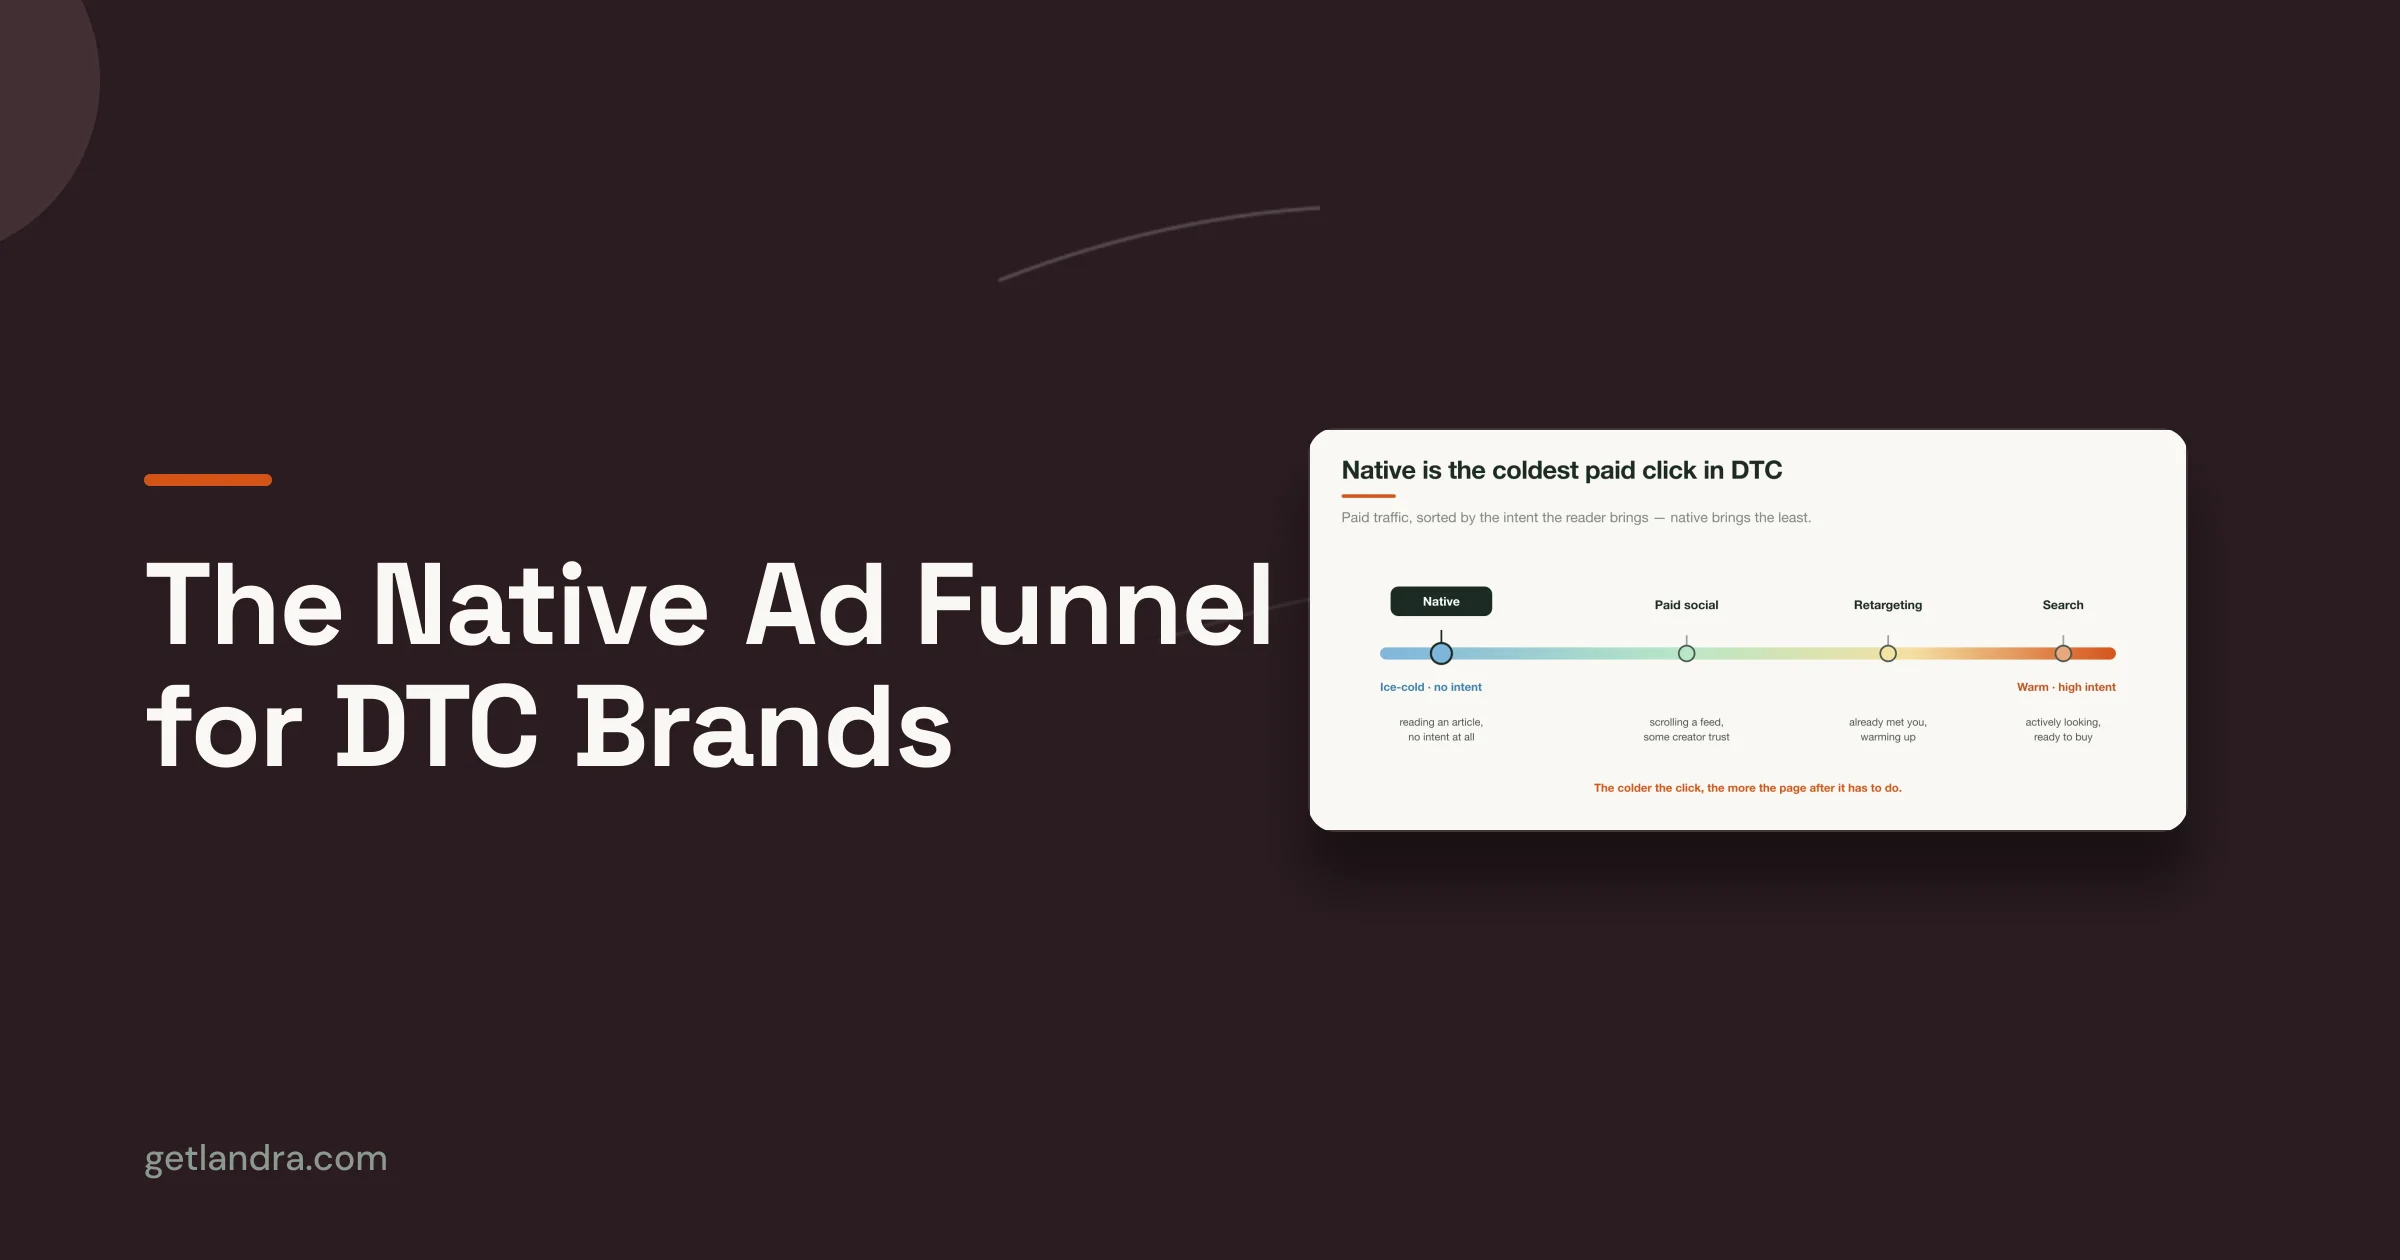
For cold traffic, the biggest single lever on your number is page type — what you send the click to. A cold visitor dropped straight on a product page is asked to buy before being convinced; a pre-sell page (an advertorial or a listicle) educates first, so the product page only has to close. The evidence is directional, not a controlled trial, but it converges from several independent angles.
The page-type lift (vendor, directional). TrueProfit reports that sending Facebook traffic straight to a product page might convert "around 0.5%," while adding an advertorial in between "can jump to 3–5%." It's a vendor figure on its own customers, so read it as directional — but the mechanism behind it is backed by independent research below.
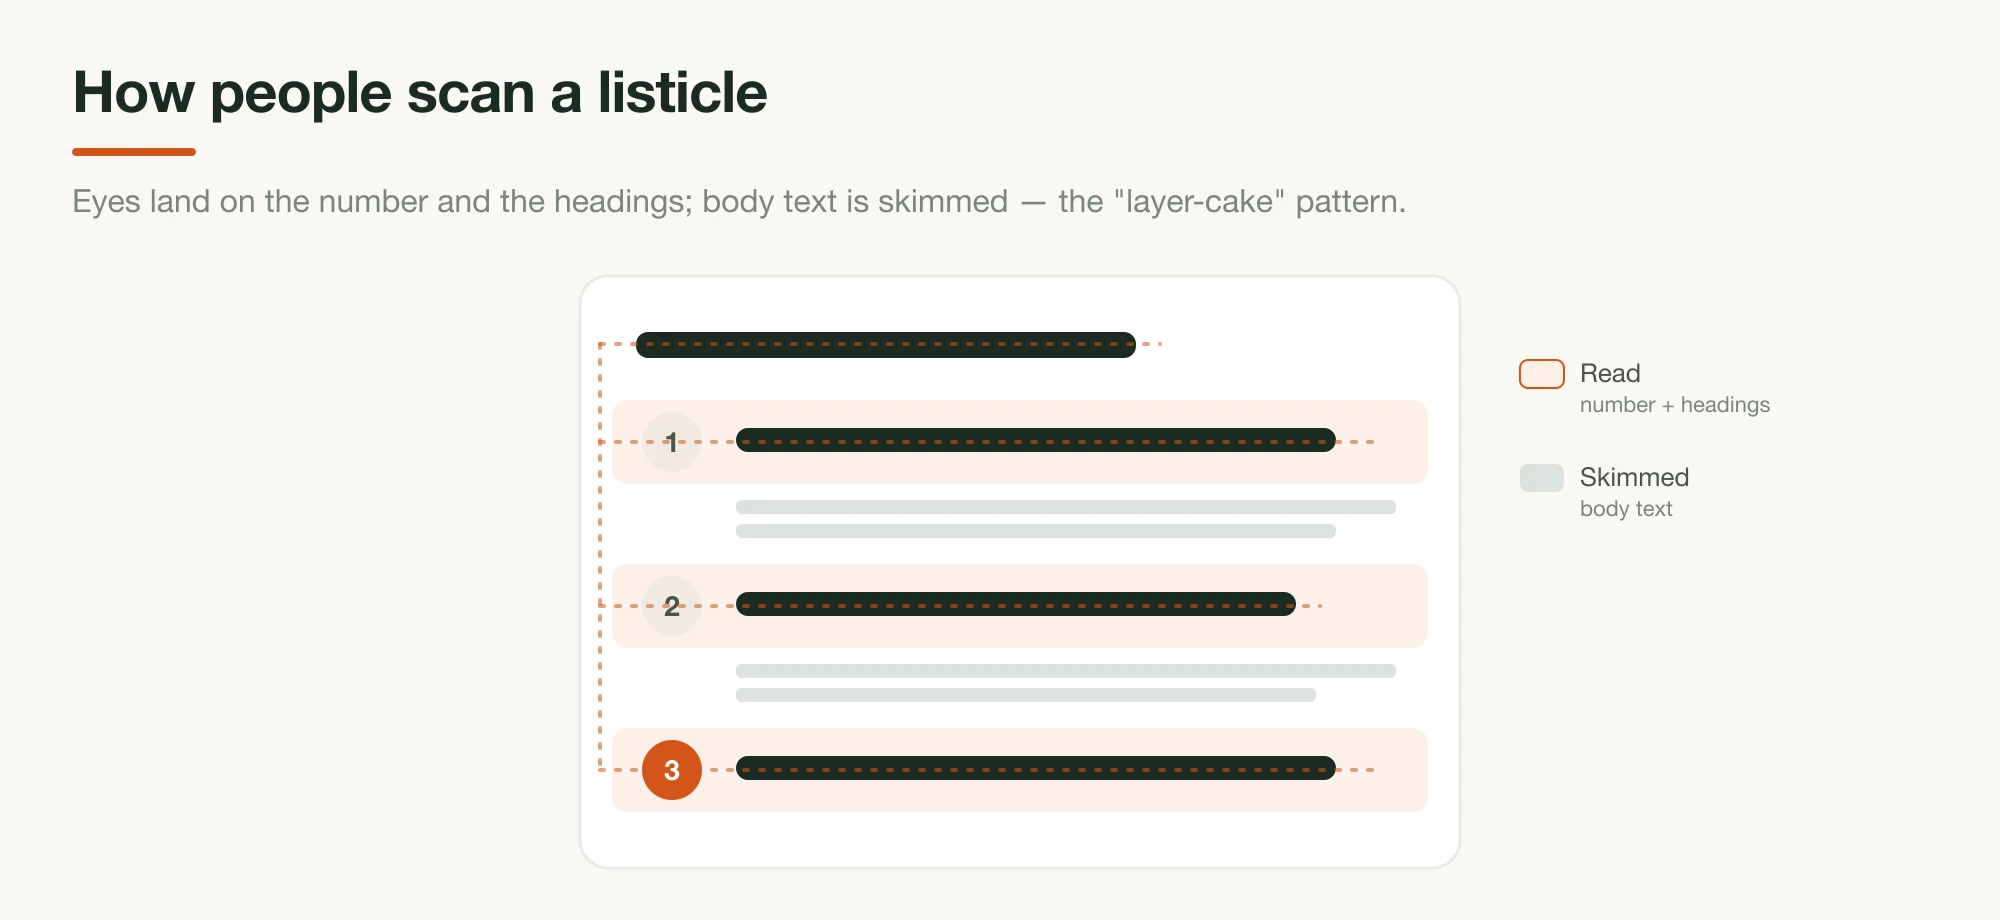
How little people actually read. Nielsen Norman Group found users read at most ~28% of the words on an average visit (the realistic figure is closer to 20%), and scan pages in a stable F-shaped pattern first documented in 2006 and re-confirmed unchanged years later (NN/g, "How Little Do Users Read?"). That's the whole structural case for a listicle: a numbered, scannable page survives the way people read; a dense block of copy doesn't.
Write it plainer. Unbounce's ecommerce data found pages written at a 5th-to-7th-grade reading level converted at a 5.6% median, versus 1.5% at a professional reading level (Unbounce ecommerce report, 2024 data). Plain and scannable beats clever and dense — on a pre-sell page especially.
Speed is a tax on everything. Portent found ecommerce conversion fell from 3.05% at a one-second load to 1.68% at two seconds to 1.12% at three (2022 data). A Google-commissioned study (2019 data) found every 0.1-second mobile speed improvement lifted retail conversion 8.4% and AOV 9.2% across 37 sites and 30M sessions (web.dev, "Milliseconds Make Millions"). The magnitudes are dataset-specific and a few years old; the direction is consistent and well-replicated.
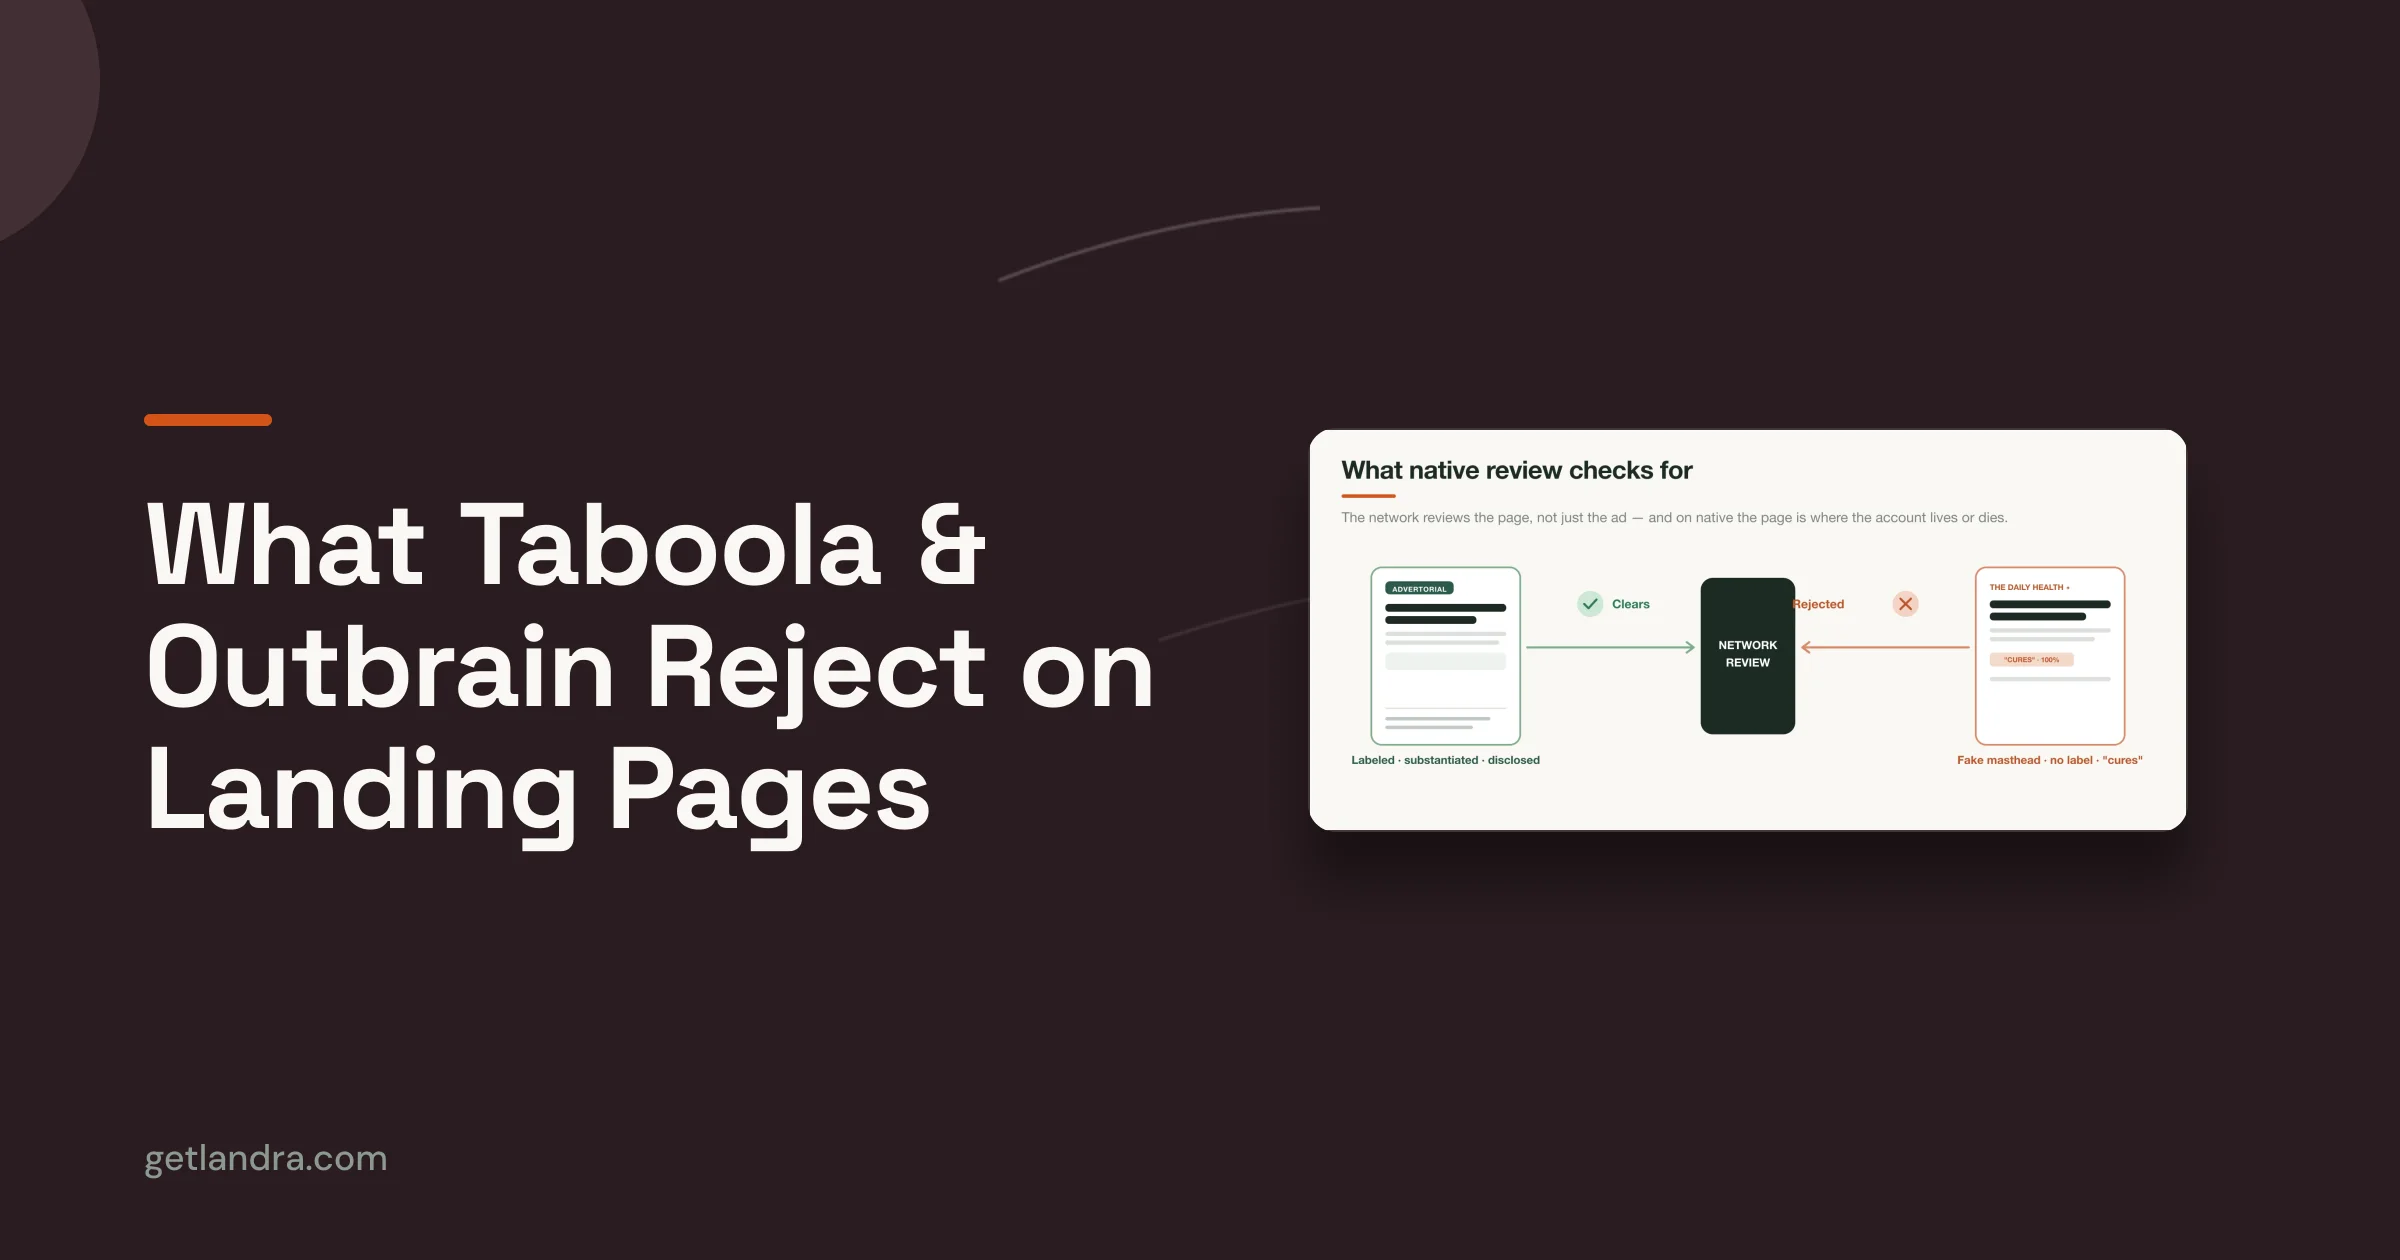
The click-in is small, so the page has to carry it. Native ad placements (Taboola, Outbrain) draw roughly 0.25–0.6% CTR by platform- and agency-reported ranges — directional, with no single primary dataset behind them. A small fraction of impressions click through, so whatever lands on the page has to do real persuasion — there's no second cheap click to waste.
And the funnel leaks at the end. Even a warmed buyer abandons: the Baymard Institute's 50-study aggregate puts average cart abandonment near 70%, higher on mobile (~80%) than desktop (~66%), and finds checkout-UX fixes can lift CVR by ~35%. With mobile near 44% of US online sales ($564B in 2024, per eMarketer data via Statista, directional), the leakage lives where the volume is.
| Lever | Reported figure | Source (date) | Read as |
|---|---|---|---|
| Advertorial vs straight-to-PDP | ~0.5% → 3–5% | TrueProfit | Vendor, directional |
| Words read per visit | ~28% max (~20% likely) | Nielsen Norman Group | Independent |
| Scanning pattern | F-shaped (2006, re-confirmed) | Nielsen Norman Group | Independent |
| Reading level | 5.6% (5th–7th grade) vs 1.5% (professional) | Unbounce (2024) | Vendor |
| Load speed | 3.05% (1s) → 1.12% (3s) | Portent (2022) | Independent |
| Mobile speed gain | +8.4% CVR per 0.1s | web.dev / Google-Deloitte (2019) | Direction, not magnitude |
| Native ad CTR | ~0.25–0.6% | Taboola/Outbrain (reported) | Directional |
| Cart abandonment | ~70% (mobile ~80%) | Baymard Institute | Independent |
None of these is a one-shot proof that a pre-sell page wins. Together they describe a consistent story: people barely read, they read even less when it's dense, slow, or above their reading level, the click-in is precious, and the funnel bleeds at checkout. A pre-sell page is the structure that respects every one of those facts.
The stats we left out — and why
Some of the most-quoted "advertorial" and "conversion" numbers don't survive a source check, so they aren't anywhere above. This is the part a stat-farm can't reproduce, because it's the work of not using a number. Here's exactly what we cut and the reason for each — verify any of these yourself before you put them in a deck.
| Excluded "stat" | Why it's out |
|---|---|
| "218% conversion lift from [X]" | No traceable primary source. The figure circulates with no original study behind it; we couldn't confirm what was tested, on whom, or when. |
| WordStream's average CVR cited as ecommerce | It's largely lead-gen and search-ad conversion data, repeatedly mislabeled online as the ecommerce purchase rate. Different action, different sample. |
| "94% higher conversion from product photos" | No verifiable primary source; presented as fact across blogs with no study attached. |
| "67% / 74% of shoppers evaluate images before buying" | Survey-shaped numbers with no traceable, current source we could check. Soft-claim folklore. |
| "X% of DTC brands use AI" | A traffic/adoption stat, not a conversion stat — and the versions in circulation don't trace to a primary source. Off-topic here regardless. |
The rule we hold: a benchmark you can't source is worse than no benchmark, because it sounds authoritative while being unaccountable. If a figure isn't above, it's usually because we went looking for the primary source and couldn't find one — unverifiable, which is not the same as false. We say exactly that rather than launder a guess into a citation.
Where this leaves your page
Two of the levers in this data are squarely page-build decisions, not media-buying ones: page type (a pre-sell advertorial or listicle beats sending cold traffic to a product page) and speed (every second in the first three costs conversion). Both sit entirely in your control, and both are exactly the levers a pre-sell page is built to pull. The honest DIY path: write the advertorial or listicle, structure it for scanning, get the reading level down, build it mobile-first and fast, and instrument it so you're testing variants against your own number — then keep iterating, because only ~3 in 10 of those tests will win.
That's a real amount of work, repeated per audience. It's also the gap Landra is built to close. Give Landra your product or brand URL and the audience you're targeting; it analyzes your brand and products, then writes a fully optimized advertorial or listicle landing page — copy, structure, proprietary DTC conversion components, and images, all tuned to that audience — mobile-responsive and fast out of the box, published straight to Shopify (or a Landra URL / HTML export). Because the format and the audience are inputs, the same product can ship a numbered listicle for warmer, category-literate buyers and a narrative advertorial for colder, more skeptical ones — emphasis by audience, not one format forced on everyone. On the founder's own supplement campaigns, pages built this way cut CAC by 46% — that's Landra's own first-party result, not an industry benchmark.
If you want the full segmented tables behind these numbers, the conversion benchmarks hub has the by-industry and by-source cuts; for the format decision itself, advertorial vs listicle walks the awareness call. To actually write either one, start with how to write an advertorial, how to write a high-converting listicle, or the underlying craft in direct-response copywriting for DTC.
The honest read
There is no universal "good" conversion rate, and the answer was never to invent a kinder metric. Measure purchase conversion one consistent way (~1.93% is the May 2026 ecommerce anchor, per IRP Commerce — not the 6.6% form-fill figure). Benchmark it against your own vertical, because a blended average across TVs and mushroom coffee tells you nothing. Then treat that benchmark as a floor and iterate past it, knowing only about 3 in 10 tests win. And for cold traffic, pull the biggest lever first: warm the click with a pre-sell page before you ask for the sale. Every number above is sourced and dated; the ones that weren't are listed, with their reasons, where they belong — out.
Frequently asked questions
What is the average advertorial conversion rate?
There is no verified industry-wide advertorial conversion rate from a controlled study. The most-cited figure is vendor-reported: TrueProfit says sending cold Facebook traffic straight to a product page converts around 0.5%, rising to 3–5% with an advertorial in between. Read it as directional, not a benchmark — it's a single vendor's estimate, not an independent trial.
Do listicle landing pages convert?
Yes, when matched to the reader's awareness. There's no public controlled test isolating listicle vs advertorial conversion across matched traffic. Listicles convert because they fit how people read — Nielsen Norman Group found users read at most ~28% of the words on a page and scan in an F-pattern, so a scannable, numbered structure survives that behavior where a wall of text doesn't.
Does an advertorial beat a product page for cold traffic?
The reported answer is yes, but the evidence is practitioner and vendor data, not a controlled trial. TrueProfit reports ~0.5% straight-to-PDP versus 3–5% with an advertorial in between. The mechanism is sound: a cold visitor sent straight to a product page is asked to buy before being convinced, while a pre-sell page warms the click first.
What is a good conversion rate for cold traffic?
Lower than your site average, by design — cold paid social is the least intent-loaded traffic there is. The honest move is to measure cold-traffic CVR on its own, benchmark it against your vertical (not a blended cross-industry average), and improve it over time. The single biggest lever is the page type: a pre-sell advertorial or listicle beats sending the cold click straight to a product page.
Why do conversion statistics vary so much between sources?
Because they measure different actions and different samples. Some report purchase conversion (IRP Commerce ~1.93%), others any landing-page action including form fills (Unbounce's 6.6%). Some are independent transaction data; some are a vendor reporting its own customers. Always check what action and what sample a number measured before you compare your page to it.
Is there hard data proving pre-sell pages lift conversion?
No public controlled A/B test isolates pre-sell pages across matched DTC traffic. The case is built from converging directional evidence: vendor page-type estimates (TrueProfit), independent reading-behavior research (Nielsen Norman Group), reading-level and load-speed data (Unbounce, Portent, a Google-commissioned 2019 study), and checkout-leakage research (Baymard Institute). Strong direction, no single clean magnitude.