
You're spending on Meta or TikTok, the ads are getting clicks, and the landing page still won't convert cold visitors at a cost you can afford. So you rewrite the headline, swap the hero image, and change the button color, all in the same week. Nothing moves enough to trust, and you still don't know whether people left at the first screen, the offer page, or checkout.
That's the usual trap with optimizing landing pages. You're redesigning the whole page when only one step is leaking. I would find that step first, fix it in isolation, and only then test bigger changes. Format, speed, copy, and creative all matter, but they matter in an order, and testing them out of order wastes budget.
Table of Contents
- Measure the Funnel Before You Change Anything
- Match Cold Traffic to the Right Pre-Sell Format
- Fix Mobile Speed Before Testing Copy
- Test Ideas Ranked by Cold-Traffic Impact
- Copy and Creative Iterations That Hold Up
- Set Up and Run Your First Variant Test
Measure the Funnel Before You Change Anything
Say a supplement advertorial gets healthy CTA clicks, yet its checkout start rate is half that of a sister product using similar traffic. That pattern doesn't point to the headline. It points to what happens after the click, perhaps an offer page that adds choices, surprises people on price, or makes shipping unclear.
Optimizing landing pages starts with locating the weakest handoff. Pull these seven numbers before you touch copy, and split each one by mobile and desktop. If you want a structured way to think about those handoffs, it helps to build a stronger web funnel rather than treating the landing page as a standalone asset.
| Metric | How to Calculate It | Weak Signal | Where to Check |
|---|---|---|---|
| Ad-to-page rate | Landing page sessions divided by ad clicks | Large gap suggests slow load or a broken link | Analytics and ad platform |
| Bounce rate | Single-page sessions divided by total sessions | Rising on mobile only points to speed or layout | Analytics, split by device |
| CTA click rate | Main button clicks divided by page sessions | Low rate means the message or offer is unclear above the fold | Event tracking |
| Checkout start rate | Checkout starts divided by CTA clicks | Drop points to a product page or cart that adds friction | Ecommerce funnel report |
| Purchase conversion rate | Orders divided by page sessions | Compare against your own control page, not an industry average | Store analytics |
| Revenue per visitor | Revenue divided by page sessions | Can rise while conversion falls, so track both | Store analytics |
| Cost per acquisition | Ad spend divided by new customers from the page | High cost with good conversion means the traffic does not fit the offer | Ad platform plus store |
Why Clicks Alone Mislead
A stronger button can lift clicks while lowering completed purchases if it sends unready readers into a difficult checkout. The Baymard Institute checkout usability research found that 17% of US online shoppers abandoned an order in the prior quarter because checkout was too long or complicated. That's leakage past the landing page, and no headline rewrite fixes it.
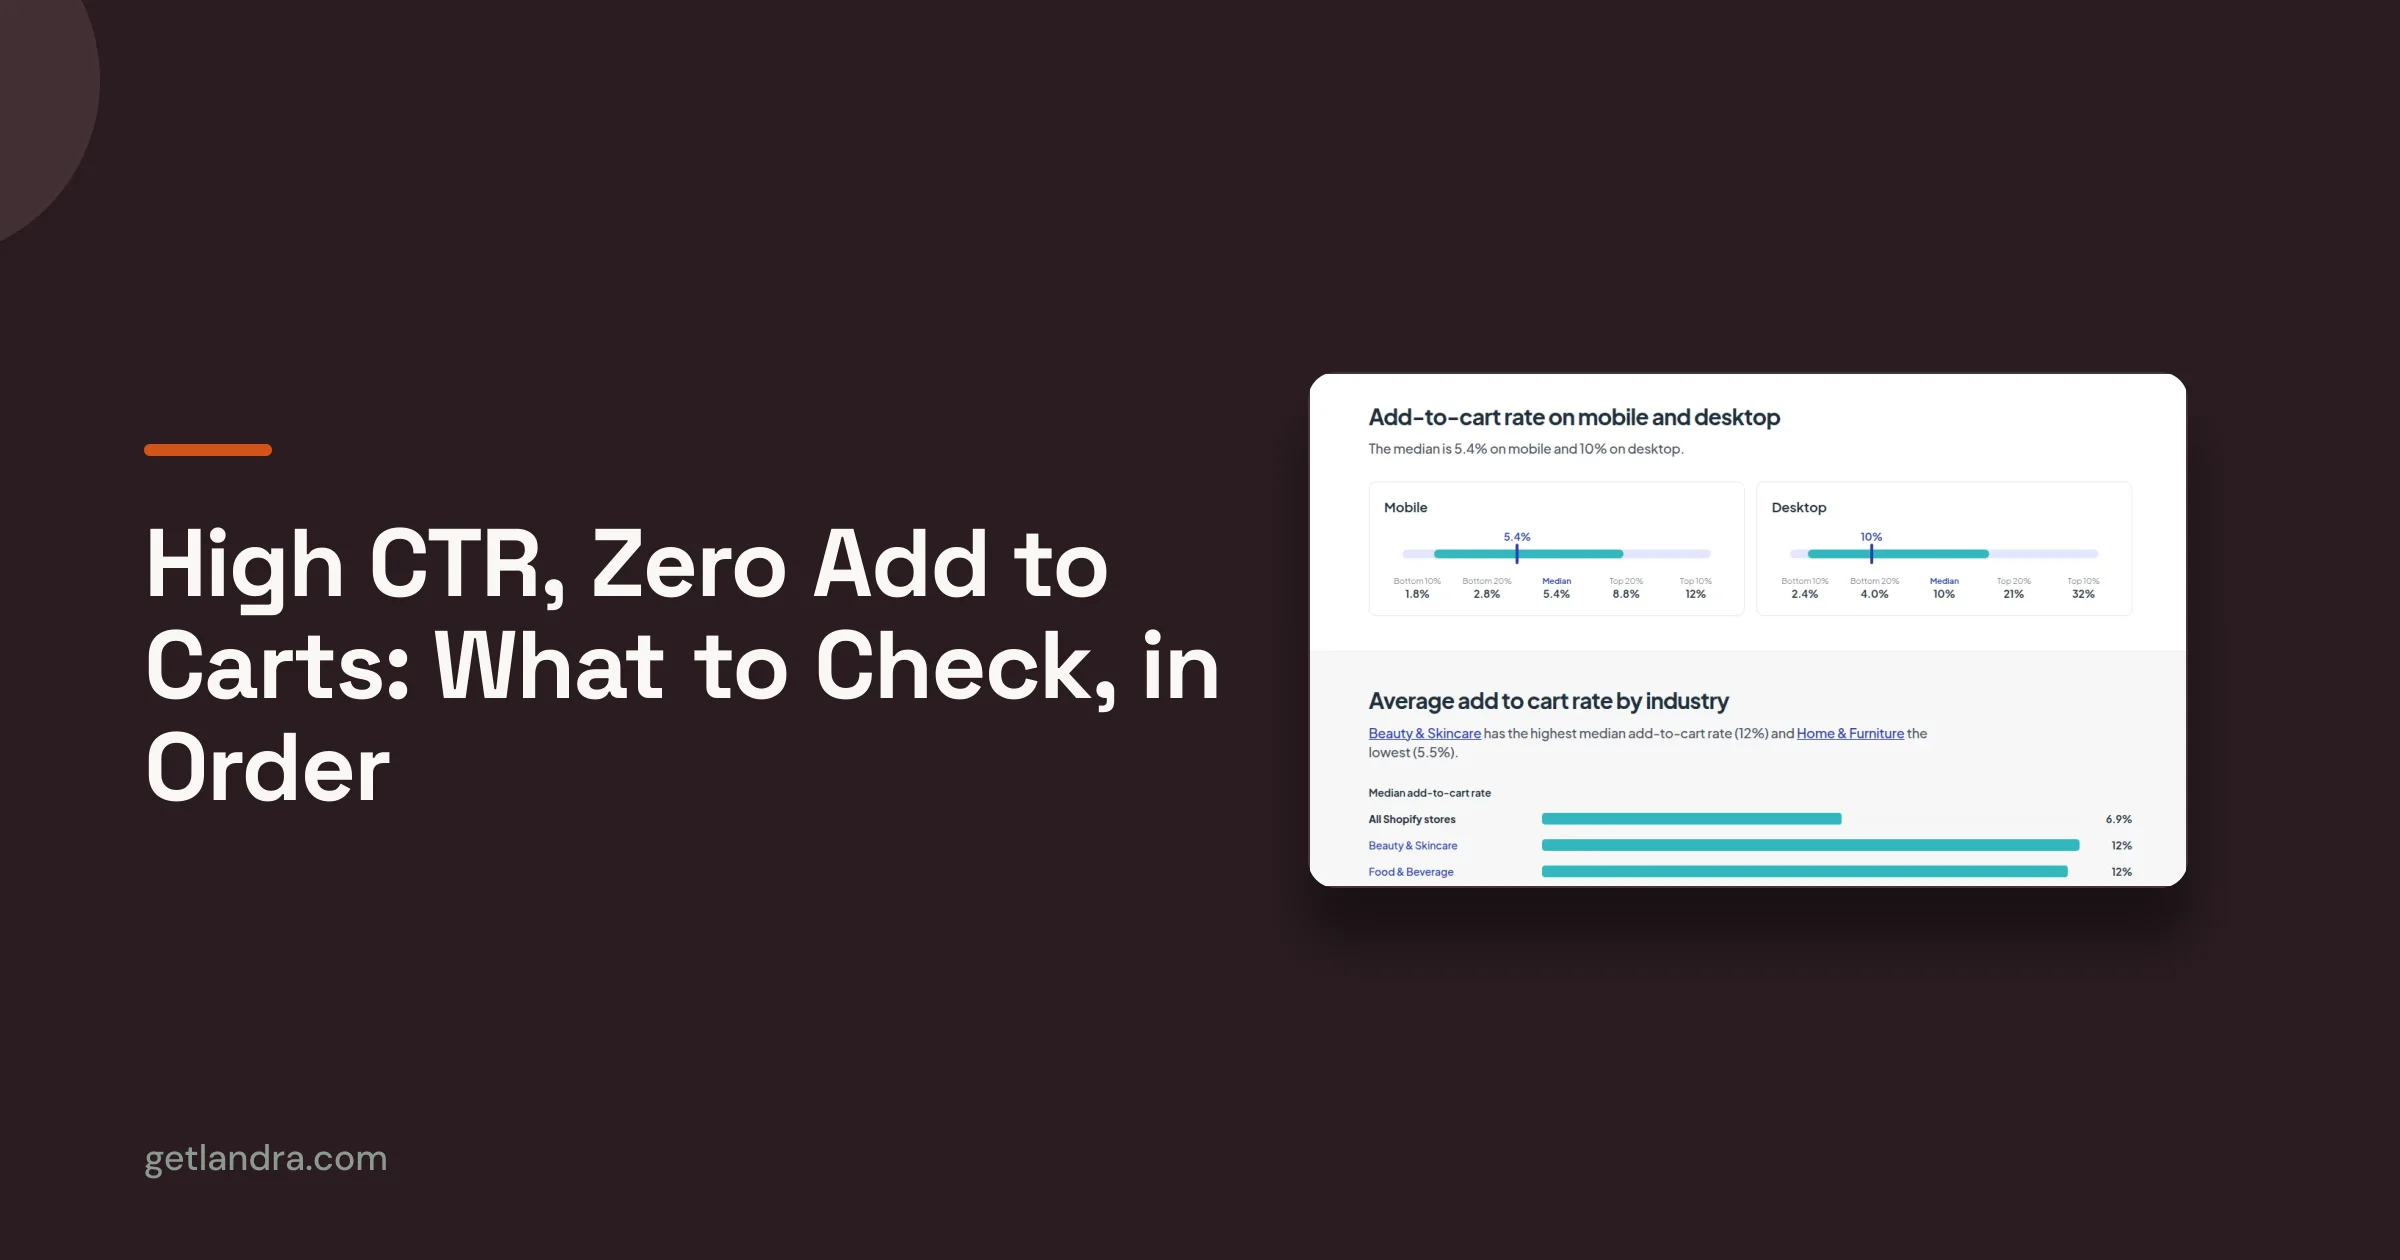
Use at least two weeks of data, keep attribution windows consistent, and benchmark against your own control first. Published medians are only a rough check. A summary of Unbounce's 2024 Conversion Benchmark Report puts median landing page conversion at 8.4% for financial services and 3.8% for SaaS, so a SaaS page at 2% deserves a closer look, while that figure says little about categories the report doesn't cover. For the arithmetic itself, use Landra's guide to interpreting CVR before you label a step weak.
Practical rule: Choose the weakest step first. Every later test should name that step in its hypothesis.
Match Cold Traffic to the Right Pre-Sell Format
The shorthand that listicles are for warm traffic and advertorials are for cold traffic is too crude to run spend on. Awareness decides the route, not temperature alone. A cold visitor who is already comparing solutions needs a different page than a cold visitor who only recognizes a problem.
This chart maps intent to the route that matches it.
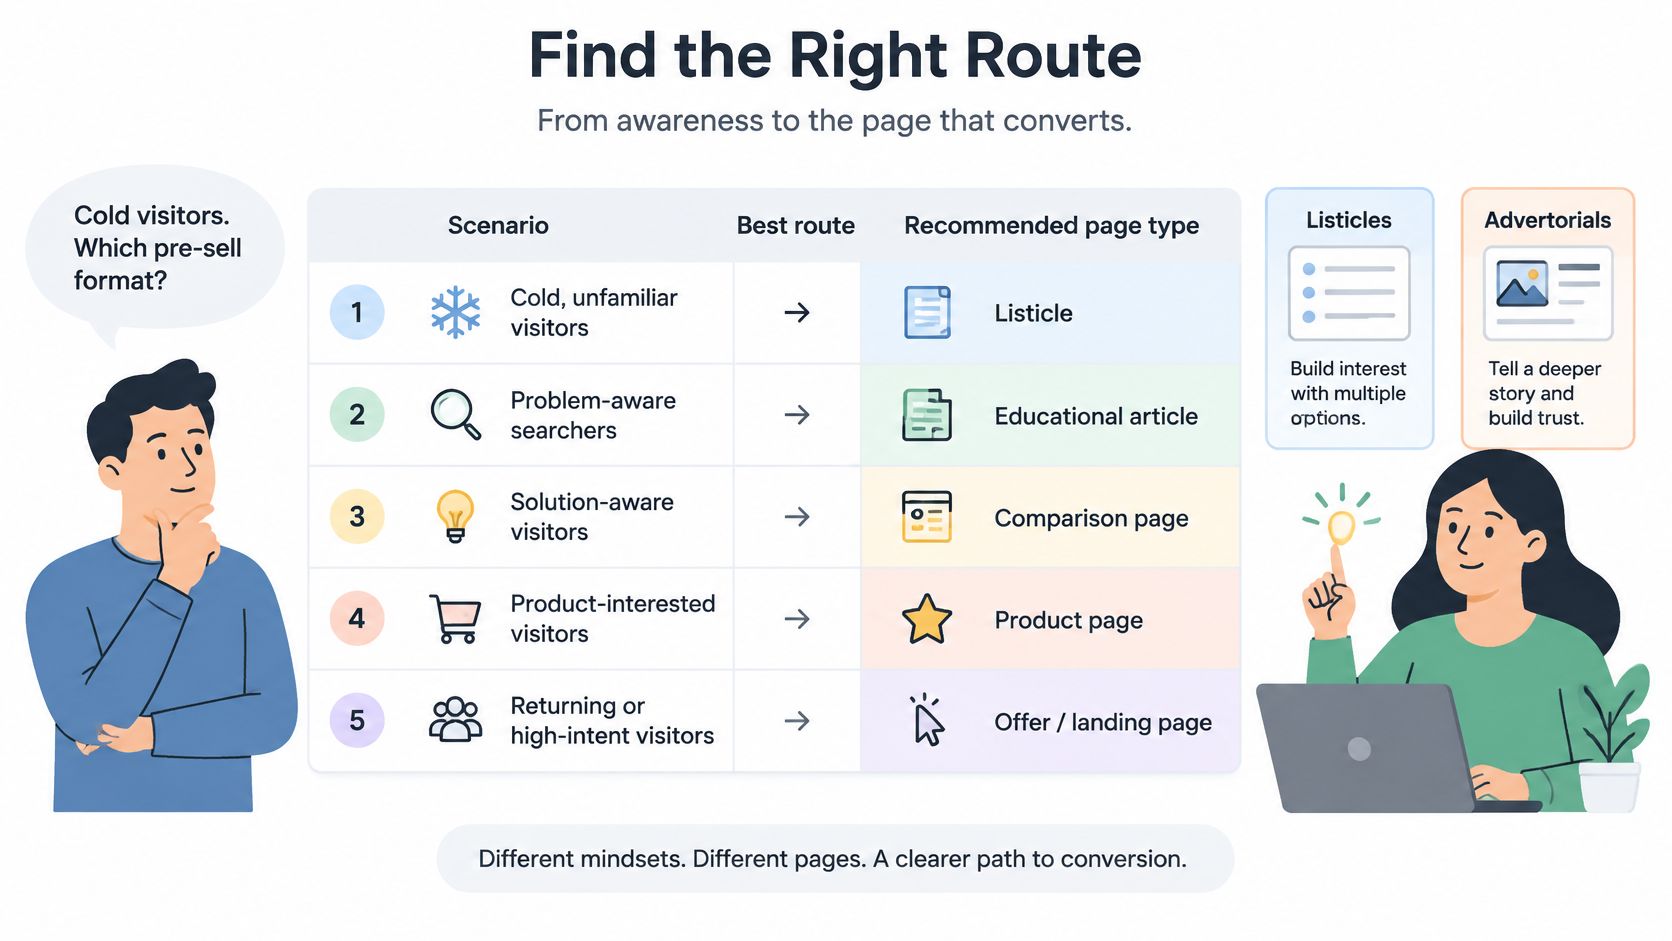
A product page leaks cold traffic because it's a closing argument delivered to someone who has just arrived. It assumes the reader knows the category, trusts the brand, and only needs price and options. Most paid social clicks haven't earned that page yet.
| Traffic Situation | Reader Awareness | Best Route | Why |
|---|---|---|---|
| Meta prospecting for an unknown brand with a high-consideration product | Problem aware, not aware of your brand | Advertorial | Narrative educates the most skeptical reader |
| Cold traffic searching a symptom or problem | Problem aware | Problem-led listicle | The headline names the problem the reader already feels |
| Traffic already comparing options in the category | Solution aware | Best-of listicle | Third-party ranking credibility fits comparison intent |
| Warm retargeting or returning visitors | Product aware | Product page or collection | The reader has already earned the closing page |
| Impulse, low-cost, self-explanatory product | Product aware | Product page | A pre-sell page adds friction when belief costs little |
The Three Listicle Frames
A problem-led list reaches the coldest readers because the headline names their problem, not your product. A best-of list borrows third-party credibility, but it only works when the brand isn't obviously ranking itself first. A product-led list suits readers who already know the category and want reasons to pick one option.
Advertorials fit high-consideration products where the reader is skeptical and needs mechanism, proof, and objection handling before price. Skip the pre-sell page entirely for impulse, low-cost, self-explanatory products. There, extra reading is friction, not education.
Format choice also affects what creative you can carry. If you're considering video to explain a product in use, this guide to videos for product landing pages is useful context on placement and purpose. The walkthrough below shows how intent changes the page's job.
One first-party result illustrates the stakes without proving a universal lift. Landra's founder ran the same ads to a Landra advertorial instead of the product page and cut customer acquisition cost by 46%. Treat that as one brand's test that needs replication on your offer, not a guaranteed outcome.
I would decide in four steps. Note the price and how much explanation the product needs, ask what the ad already told the reader, pick the format from the table, then run the pre-sell page against the product page on the same ads for a fixed window.
Fix Mobile Speed Before Testing Copy
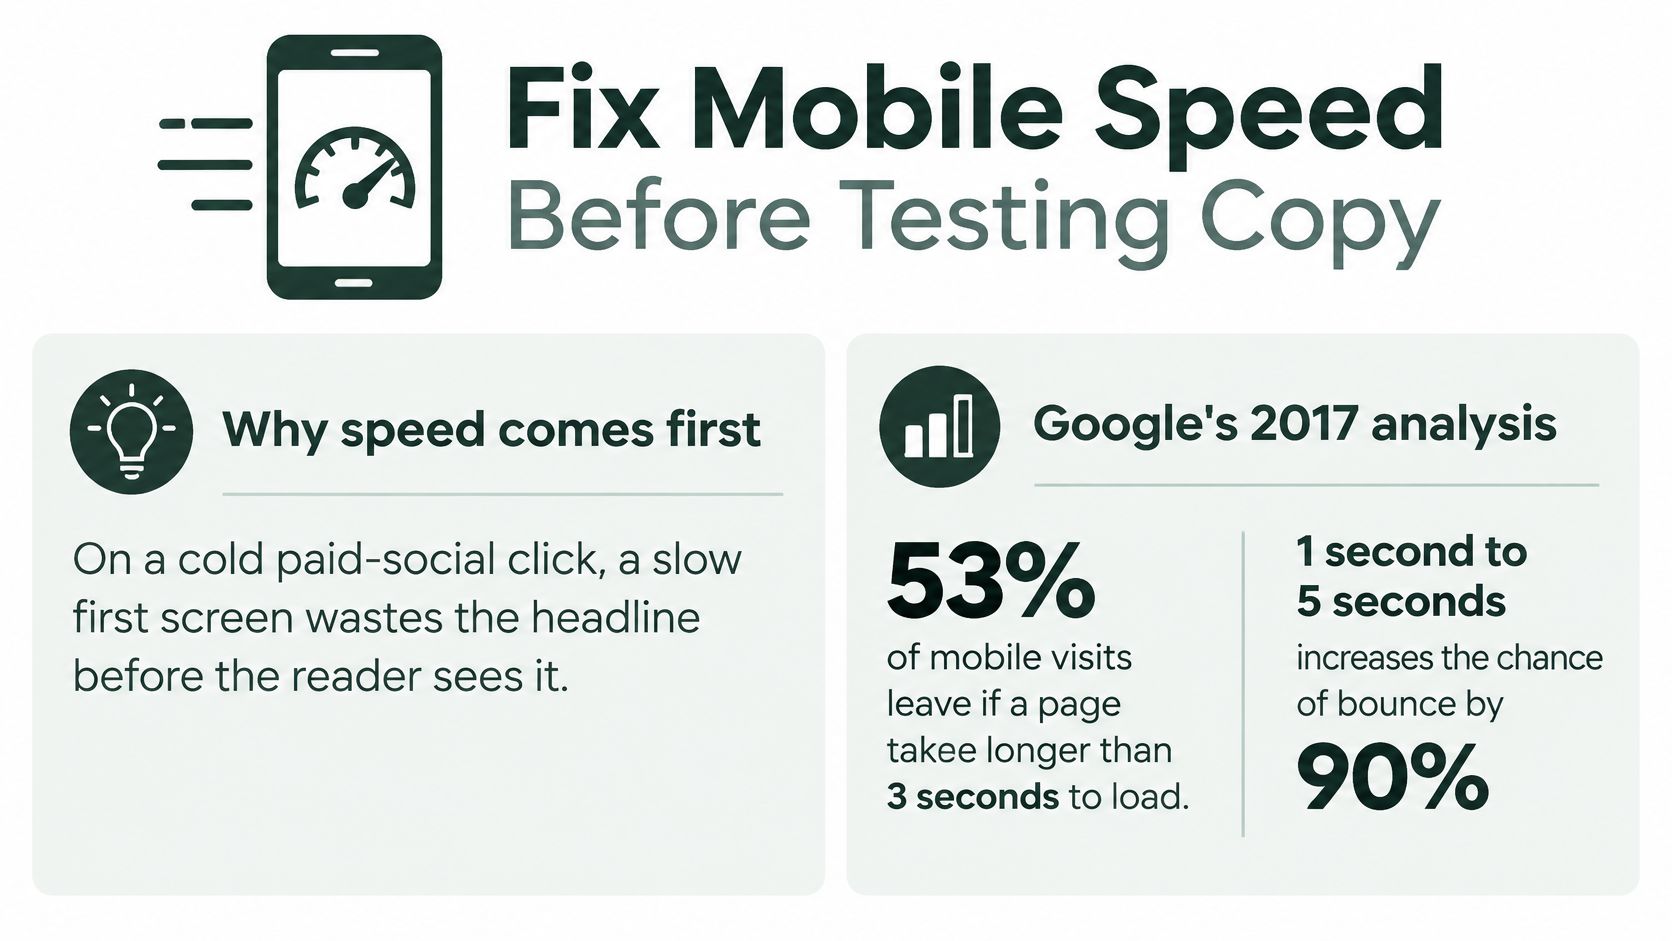
More than half of mobile visits were abandoned when pages took longer than 3 seconds to load, according to earlier Google research cited in the Google and Deloitte Milliseconds Make Millions report. That report, covering 37 retail, travel, luxury, and lead-generation brands, found a 0.1-second improvement in load time increased conversions by an average of 8% for retail sites and 10% for travel sites. Those are averages to guide testing, not guaranteed uplifts.
On a cold paid social click, a slow first screen wastes the headline before the reader sees it. Google's 2017 analysis in its mobile page speed industry benchmarks examined approximately 900,000 mobile landing pages and found the average page took about 22 seconds to fully load. Its model estimated that increasing load time from 1 second to 10 seconds raised the probability of a mobile visitor bouncing by 123%.
The infographic below sums up why speed comes before copy tests.
A Six-Step Mobile Audit
- Measure on a real phone. Use a cellular connection, not desktop WiFi, because that's how paid social visitors arrive.
- Record first appearance. Note when the headline and hero image first render, since that moment decides whether the reader waits.
- Compress images to display size. Use modern formats and don't ship a desktop file to a phone screen.
- Remove unneeded third-party scripts. Duplicate pixels, chat widgets, and review embeds each add requests the first screen doesn't need.
- Cut repeated sections. The 2017 Google analysis linked increasing page elements from 400 to 6,000 with a 95% reduction in the probability of conversion, so repeated claims carry a real cost.
- Retest after each change. Log the speed shift beside the conversion shift so you know which change did the work.
If you need the technical sequence, work through how to improve LCP on mobile landing pages before you launch copy variants. Track conversion rate, bounce rate, and cost per acquisition in the speed test, not page views alone.
A variant that loads slower than its control should not be judged on copy alone.
Test Ideas Ranked by Cold-Traffic Impact
Don't rank test ideas by what's easiest to change in the editor. Rank them by where cold readers decide to stay or leave. I would start with the element where the gap between what the ad promised and what the first screen shows is largest.
Say an ad promises "no more morning bloating" and lands on a page headed "gut health science." That page needs a headline test first, not a discount test. The reader clicked for relief from a specific problem, and the page answered with a category lecture. That mismatch is an early bounce waiting to happen.
| Element | Variant to Test | Why It Matters for Cold Traffic | Priority |
|---|---|---|---|
| Opening line | Problem-led first sentence versus product-led first sentence | Cold readers respond to their problem before they respond to your product | High |
| Headline | Headline repeating the exact ad promise versus a broader brand claim | A mismatch between ad and page is the most common early bounce cause | High |
| Proof above the fold | Named customer reviews versus one aggregate star rating | Specific proof lowers skepticism for an unknown brand | High |
| CTA wording and placement | Outcome-based button text versus Buy Now, with or without a mid-page repeat | Readers need a clear next step at the moment of agreement | Medium |
| Form length | Email-only capture versus full checkout fields | Every extra field adds friction before the reader is committed | Medium |
| Image treatment | Lifestyle image versus product shot on mobile | Heavy images cost load time and can push the offer below the fold | Medium |
| Offer framing | Percentage discount versus outcome or guarantee | Changes what the reader sees as value once the first screen works | Low |
How to Read the Ranking
The top three rows all sit on the first screen, and that's deliberate. Problem-led openings tend to beat product-led ones with cold readers because they start from something the reader already believes. Named reviews or specific outcome numbers outperform a single aggregate star rating for unknown brands because a stranger has no reason to trust your average yet.
The medium rows matter once the reader stays. Button text that states the outcome, plus a second CTA mid-page, gives readers a next step at the moment they agree with a claim, instead of forcing them to hunt. Email-only capture beats full forms when the offer is low-commitment, because you're asking for a small step before commitment exists.
Image treatment sits in the middle for a practical reason. Lifestyle images can build belief, but they cost load time and can push the offer below the fold on mobile. Offer framing comes last because a better discount frame can't rescue a first screen that already lost the reader. It changes perceived value only after the message lands.
Test one high-priority element at a time. Don't call a winner from the first few conversions, and don't stack a headline change with a new offer and then guess which one worked. When you're optimizing landing pages for cold traffic, a clean read on one element beats a muddy win you can't repeat.
Copy and Creative Iterations That Hold Up
Start every iteration from two fixed points, the ad's exact promise and the reader's awareness stage. If those two don't match, better sentence craft won't save the page. Write three openings from different angles and test them as separate variants, not as one blended draft.
- Problem angle: Open with the symptom in the reader's words, for example waking up bloated despite eating carefully the night before.
- Mechanism angle: Open with why the usual fix fails, then name the different process your product uses.
- Social proof angle: Open with a named customer type and a specific result, placed where a skeptic sees it before scrolling.
Writing Rules That Survive Testing
Replace generic claims with specifics, a number, a timeframe, or a named customer type. "Supports gut health" says nothing a cold reader can picture. "A 14-day morning routine" at least gives the reader a shape, a duration, and a moment in the day.
Keep the page scannable on a phone. Use a headline under 12 words, a subhead on one line, and short paragraphs of two to three sentences. Long blocks that read fine on desktop become a wall on mobile, and cold readers skim before they commit to reading.
Match the image to the claim. Show the product in use rather than a floating packshot for cold traffic, because use explains what the product is for. Use before-and-after visuals only where you can substantiate them and platform rules allow it.
Place reviews near the button, not at the bottom of the page. Proof does its work at the moment of hesitation, which is the click, not the footer. Rewrite the CTA to state what happens next, such as "See the 14-day routine" instead of "Buy now," so the click feels like information rather than commitment.
For advertorials, write in an editorial voice that still states the offer clearly and carries any required disclosure. Burying the offer to sound like journalism backfires when the reader reaches price unprepared. Iterate in batches, change one idea per variant, pick the winner, then refine its supporting sections. Keep brand voice consistent across variants so the test measures the message, not the tone.
Iteration rule: A small win from a variant that explains a new reason to buy is worth more than a large win from a louder button.
The louder button win usually doesn't transfer to the next campaign. A new reason to buy does, because you can carry it into ads, emails, and the next page.
Set Up and Run Your First Variant Test
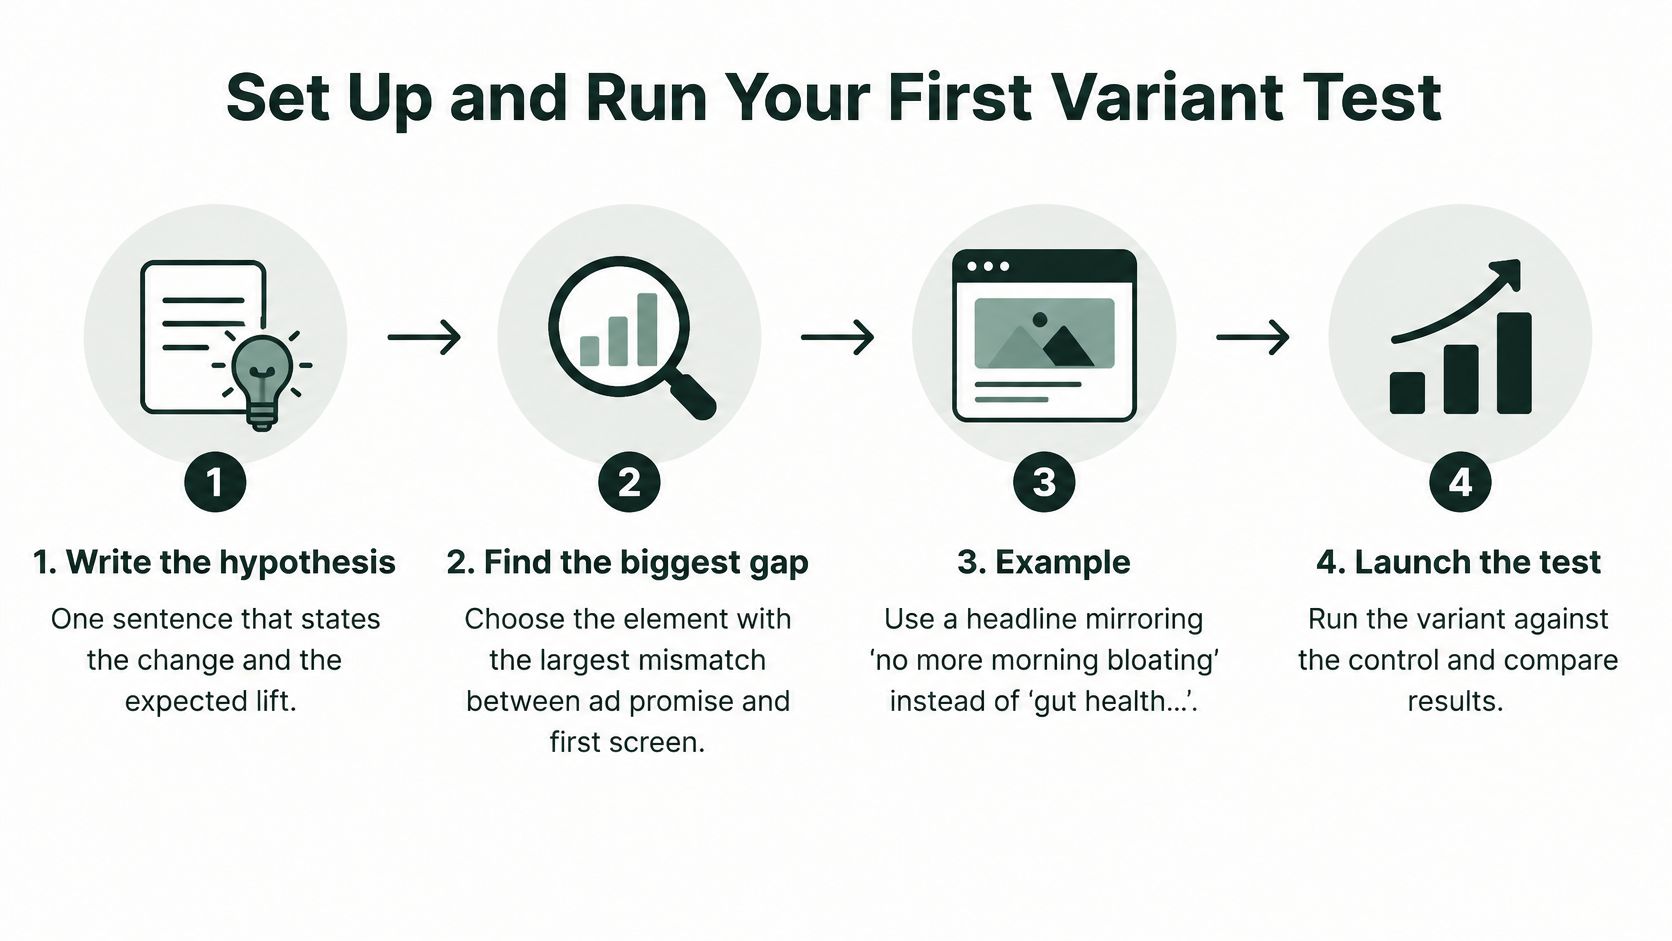
Write the hypothesis in one sentence before you build anything. Pick the element with the largest gap between ad promise and first screen, such as a headline mirroring "no more morning bloating" instead of "gut health science." If you can't state the change and the expected effect in one sentence, the test isn't ready.
The flow below shows the sequence from hypothesis to launch.
The Seven-Step Workflow
- Duplicate the control. Change only the hypothesis element, and name the variant by hypothesis, such as "problem-open-v2," not by date.
- Set the rules before launch. Fix the traffic split, minimum run length, and success metric, which should be cost per acquisition or purchase rate, not clicks.
- Add a speed gate. The variant must load no slower than control on a mobile connection, or you're testing load time by accident.
- Hold ads constant. Keep creative and audiences unchanged so traffic quality doesn't shift mid-test.
- Track consent separately. Send both variants through the same events and report conversion by consent state, since opt-in and purchase can diverge once a cookie banner appears. Test banner placement and wording as separate hypotheses, and keep the page usable for visitors who decline cookies and for keyboard and screen-reader users.
- Review after two weeks. Split funnel metrics by mobile and desktop, and if the variant wins on conversion but loses on speed, fix speed before scaling.
- Stop at the planned sample. Record the result, make the winner the next control, and write the next hypothesis from what you learned.
On sample size, don't improvise. This explainer on 95% confidence in A/B testing covers why calling a test early produces winners that vanish at scale. For the broader method, these notes on how to improve conversions with landing page tests pair well with the workflow above.
Trust a result only when you have enough conversions, unchanged ads, consistent tracking, and a win that holds across devices. A mobile-only win with a desktop loss isn't a winner, it's a segmentation finding. The Headline Analyzer and Conversion Rate Calculator work as sanity checks before launch, not as substitutes for the test itself.
Practical setup matters too. Landra's generated landing pages are separate from the Shopify theme, so building and testing them does not change the storefront design or checkout flow. If an outside team builds your pages, keep ad accounts, creative, and test setup in your name. In Landra's model, Landra builds and launches the pages while the customer keeps its ads, ad creative, and test setup, which keeps ownership where it belongs.
If you're optimizing landing pages for cold paid social traffic and your bottleneck is producing testable variants fast enough, Landra generates advertorials and listicles from your product URL that you can edit, duplicate, and publish to Shopify, a Landra URL, or HTML export. Start with the Starter plan, build your first variant against your current control, and let the funnel numbers decide.