
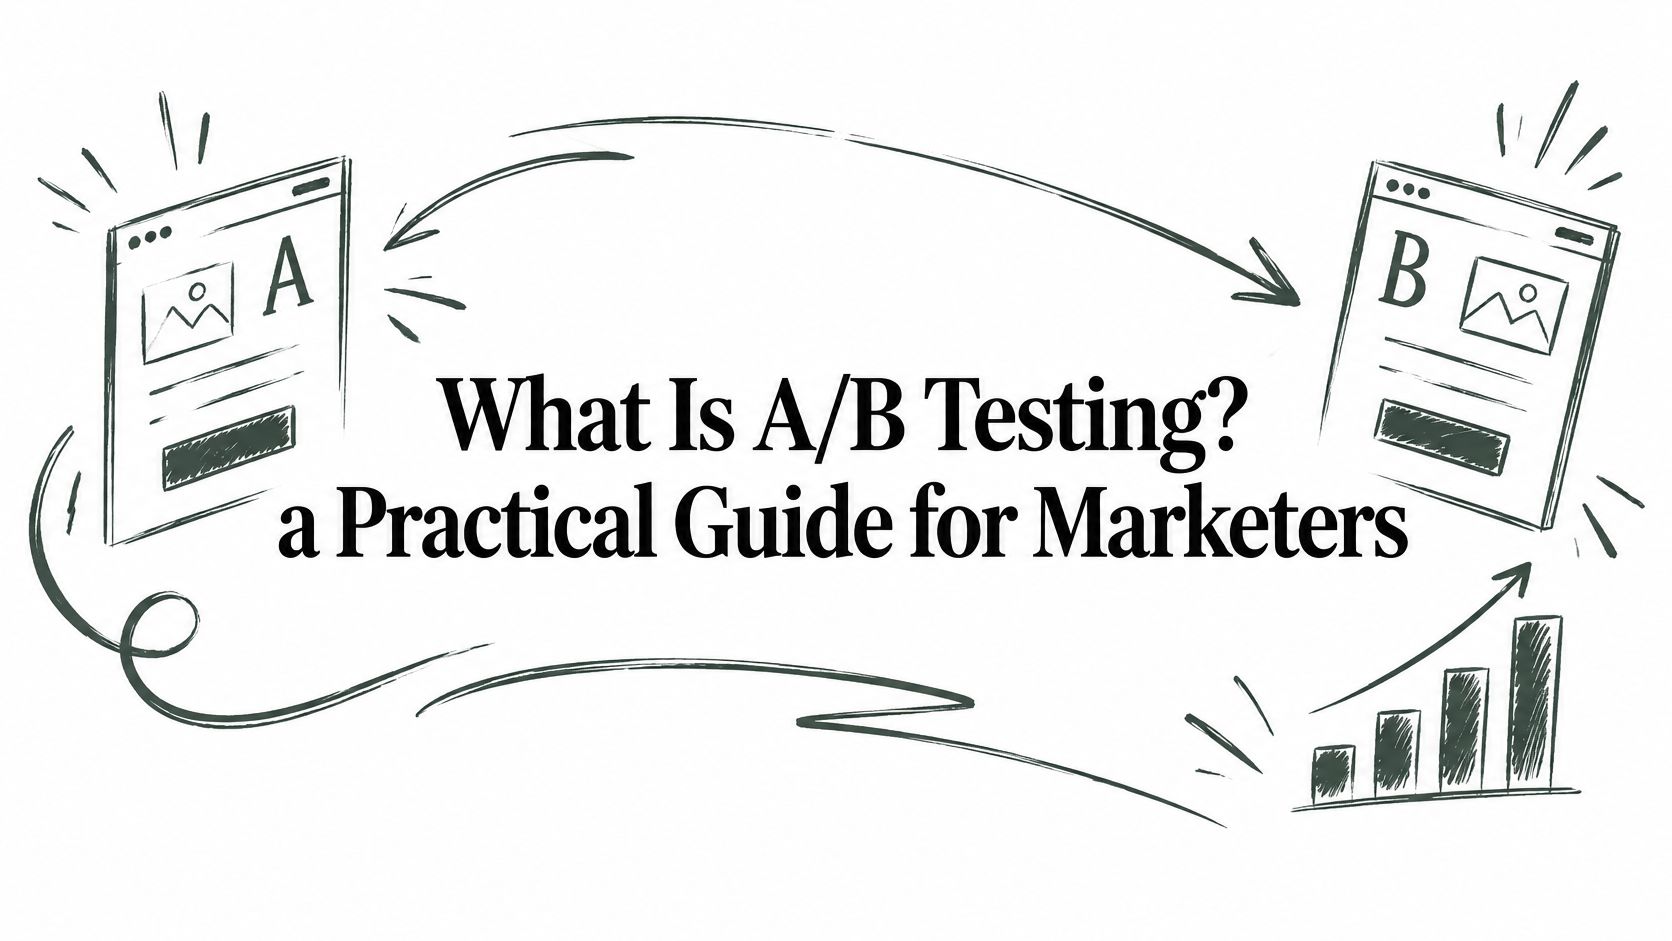
A/B testing randomly splits visitors between a current version (the control) and a changed version (the variant), then compares both on one primary metric such as conversion rate.
You've rewritten a landing page headline, and your team prefers the new version. Before sending all your paid traffic to it, you need to know whether shoppers respond better, not just whether your colleagues like it. A well-designed test helps you make that decision, but only if you decide in advance what evidence counts and when you'll stop.
Table of Contents
- Define A/B Testing and Its Core Terms
- Why Teams Test Instead of Guessing
- Sample Size and Statistical Significance Explained
- How to Design an A/B Test Step by Step
- Pitfalls That Create False Winners
- Landing Page and Ad Test Examples
- Run Your First Test This Week
Define A/B Testing and Its Core Terms
Think of a shop with matching storefront windows. You change the display in one window and compare how often passersby enter through each entrance. Online, you can make that comparison more fairly by randomly assigning visitors to the different experiences.
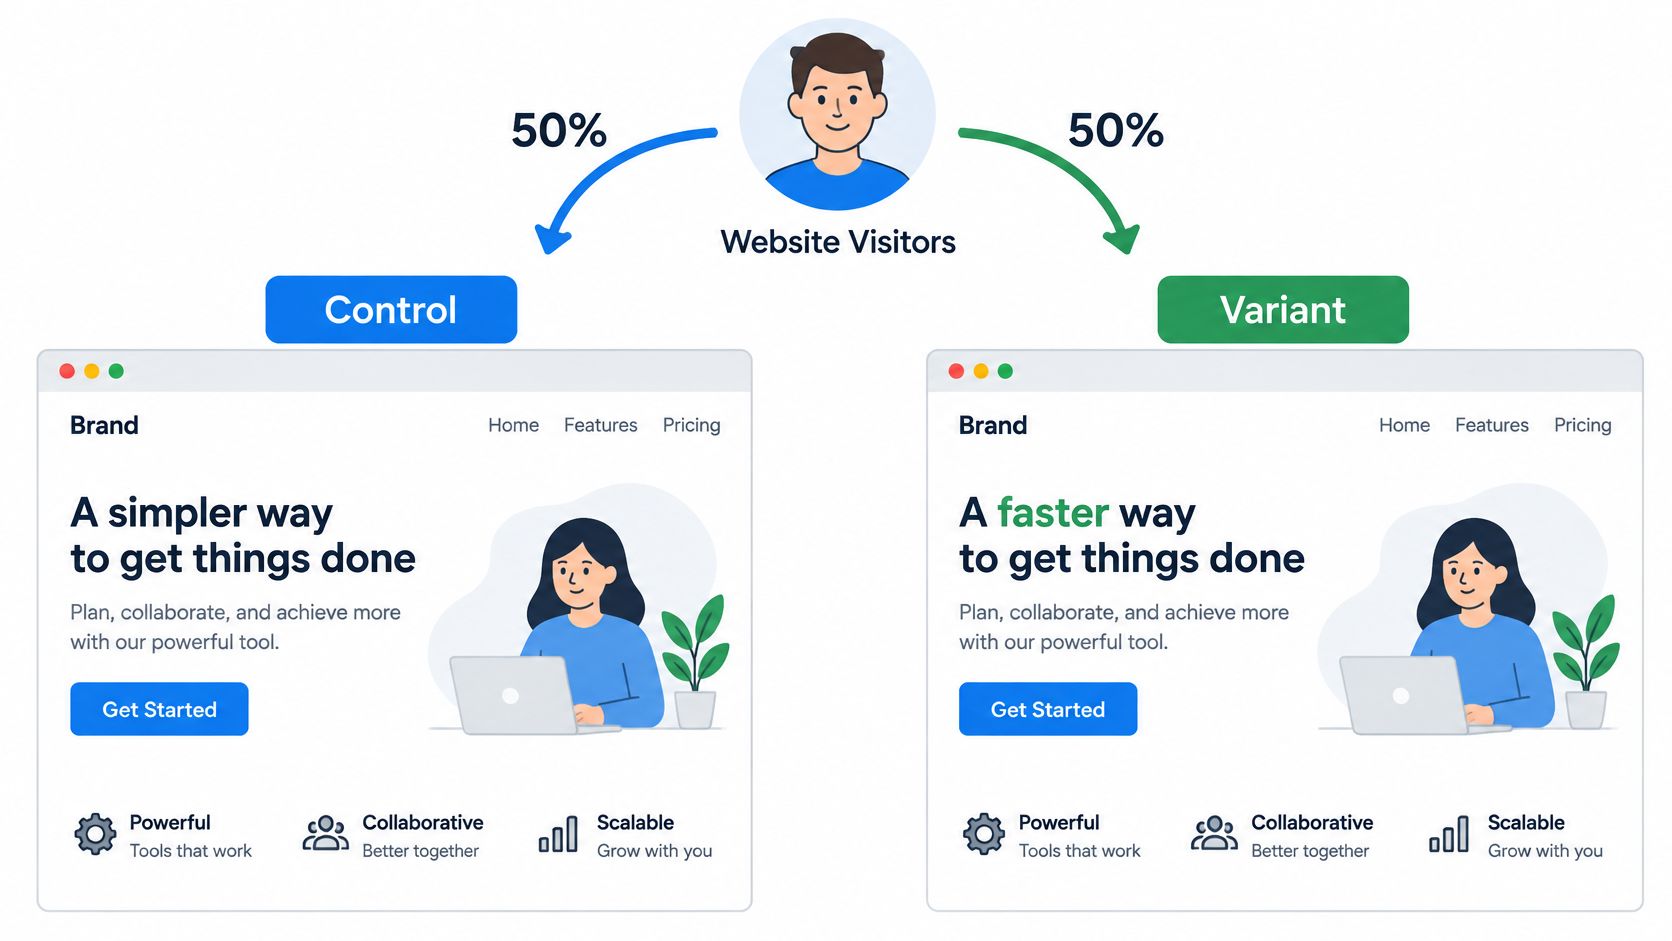
Your existing product page becomes the control. A copy with a problem-led headline becomes the variant. Random assignment spreads visitor differences across the groups in expectation, rather than putting all returning customers in one group and unfamiliar shoppers in the other. It doesn't guarantee perfectly matched audiences, especially with a small sample.
The diagram shows how visitors reach the competing pages.
Core A/B testing terms
| Term | Meaning | Example |
|---|---|---|
| Control | The current version visitors already see | The existing product page |
| Variant | The changed version tested against the control | Product page with a problem-led headline |
| Primary metric | The outcome that decides the test | Add-to-cart rate |
| Conversion rate | Share of visitors who complete the goal | In a hypothetical example, 40 buyers from 1,000 visitors is 4% |
| Lift | Relative change in the primary metric | Hypothetically, 4% rising to 5% is a 25% lift |
| Allocation | Share of traffic assigned to each version | An equal split between the pages |
| Statistical significance | A result meeting a predefined statistical evidence threshold | The headline comparison passes the planned significance test |
| Sample size | Observations needed for the planned comparison | Required visitors per page, calculated before launch |
| Randomization | Assignment by chance rather than visitor preference | The testing platform assigns eligible shoppers |
| Test duration | The planned measurement window | Both pages run over the same dates |
Lift is relative change, not the simple difference between rates. Statistical significance also isn't a promise that a variant will keep winning.
Testing is a standard marketing practice: 55% of in-house marketers reported conducting A/B and multivariate testing in 2024, in a global survey of 327 marketers by Funnel and Ravn Research, reported by EMARKETER.
Why Teams Test Instead of Guessing
Say a skincare brand pays for social ads that send shoppers to a product page. The team suspects that visitors need an explanation of the product before seeing the purchase offer. If that explanation helps more of the existing visitors buy, the brand can generate more revenue without buying more clicks.
But the opposite could happen. A longer explanation might distract shoppers who were ready to purchase. Testing lets the team compare those possibilities before committing to a redesign.
There are practical reasons to use experiments:
- Replace opinions with behavior. A designer's preference and a founder's intuition become hypotheses, not final answers.
- Understand audience response. A deliberately planned test for cold traffic can assess whether unfamiliar buyers need a different opening.
- Limit exposure to a poor change. Only the assigned test audience sees the variant while the team evaluates it.
A useful test doesn't always produce a winner
An Octoagency benchmark summary describes an analysis of 173,000 experiments in which only 12% produced a statistically significant improvement, alongside another dataset where about 33.5% of 1,001 tests produced a significant positive result. These are separate datasets, not a universal forecast for your store.
A flat result can mean the change had little effect. It can also mean the sample was too small, implementation weakened the idea, or shopper behavior was too variable to support a clear decision. Don't translate an inconclusive result into proof that customers dislike the concept.
Judge an experiment by whether it reduced uncertainty about a business decision, not by whether the dashboard displayed a winner.
For a modest-traffic store, prioritize questions with consequences: whether shoppers need education before the offer, whether a comparison page helps them choose, or whether a different audience angle improves purchase intent. Save minor wording refinements for situations where your traffic can support them.
Sample Size and Statistical Significance Explained
Two identical pages, split 50/50, will sometimes produce a "winner." Run enough of these A/A comparisons and a predictable share crosses the significance line by luck alone. If you set a 5% significance threshold, roughly 1 in 20 identical-page tests lands above it. That rate is built into the threshold itself: it is the price of being willing to act on evidence at all.
Statistical significance works best as a decision rule. It answers one narrow question: did the result clear the bar you set before collecting data? Crossing the bar means the observed gap is unlikely under pure chance. It says nothing about whether the gap is large enough to matter commercially, which is where beginners trip first. A statistically significant lift can still be too small to pay for the rollout.
False-positive risk as comparisons increase
A fair coin shows streaks if you flip it enough times. Each test, variant, audience slice, and mid-test check of the dashboard is another flip.
| Scenario | Comparisons | Chance of at least one false positive |
|---|---|---|
| One test at 95% confidence | 1 | About 5% |
| Ten independent tests | 10 | About 40% |
| Fifteen variants compared at once | 15 | About 54% |
| One test stopped the moment it turns significant | Every check counts as another comparison | Grows with each peek; the exact figure needs sequential-testing methods |
These estimates assume independent comparisons. Variants sharing a single control aren't fully independent, so the true combined risk calls for a proper multiple-comparison adjustment rather than this simple math.
The mechanism behind every row is the same: each comparison is a lottery ticket. Checking many metrics, slicing audiences, running several variants, and reporting only the best one makes chance patterns indistinguishable from real improvements. Stopping early the moment a result turns green is the same move, because every look is another ticket. Set the decision metric, the sample plan, and the end date before launch, then let the test run to its planned finish.
Why smaller effects require more traffic
Statistical power is the probability that your test detects a real effect of the size you planned for. Your baseline rate, outcome variability, target effect, significance threshold, and chosen power all feed the required sample.
The relationship is punishing: Microsoft's experimentation guidance explains that detecting a 0.1% difference can require approximately 10,000 times the sample needed to detect a 10% difference, because sample requirements scale roughly with the inverse square of the effect size. Halving the effect you want to detect roughly quadruples the traffic you need.
Plan with your own store's baseline, since required sample depends on where you start. Landra's free Conversion Rate Calculator can help you work out planning figures, but another brand's rate isn't a substitute for your own measurement.
An inconclusive result leaves the question open rather than closing it. Read the estimated effect together with its uncertainty range: the data may still be compatible with a lift worth having. If the plausible range runs from a costly loss to a worthwhile gain, you haven't earned a confident rollout decision, and the honest options are more data or a bolder change.
How to Design an A/B Test Step by Step
Write the experiment plan before building the variant. Microsoft's guide to experimentation pitfalls emphasizes random assignment, reliable measurement, and A/A checks, and explains why 50/50 allocation is exposure-efficient for a conventional comparison between control and treatment.
The visual summarizes the core workflow.
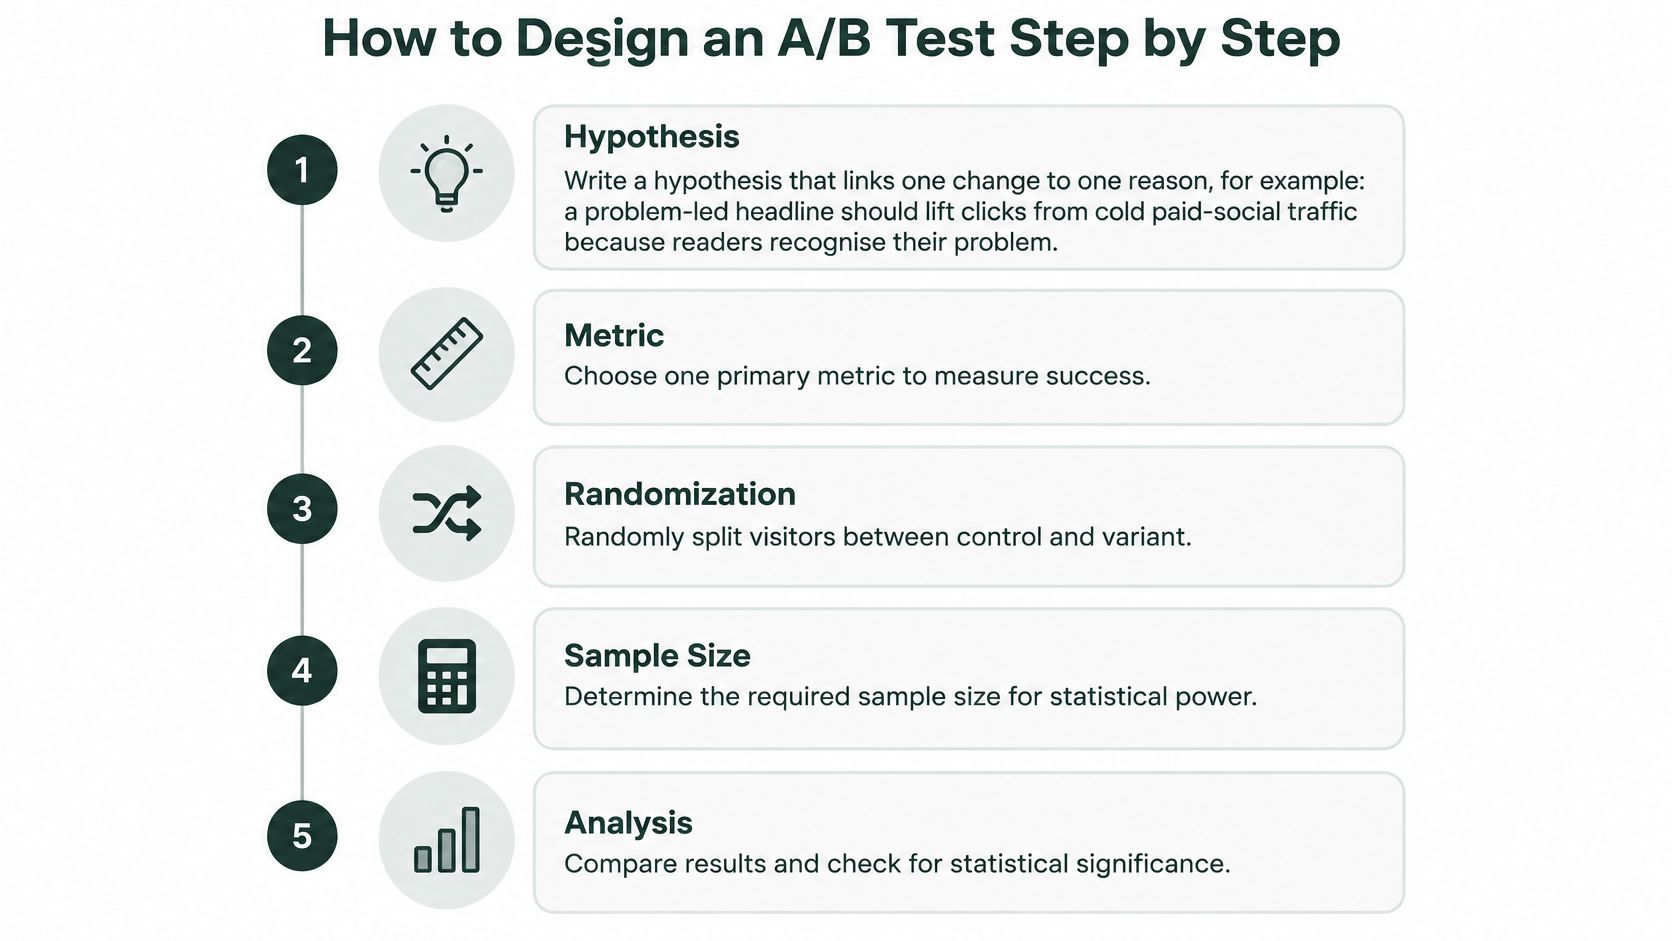
Write a testable hypothesis. A problem-led headline should improve add-to-cart behavior among cold visitors because they'll recognize relevance sooner. Avoid starting with a preferred design and inventing the reasoning afterward; Grumspot's guide to how to build Shopify test hypotheses offers useful context for turning observations into test ideas.
Choose the primary metric. Pick the outcome closest to the decision, such as purchase conversion rate or revenue per visitor. A common slip is choosing easy-to-generate clicks when the actual question concerns sales.
Measure a representative baseline. Use a stable recent period with the same audience and tracking definitions you expect during the experiment. Don't use a promotion-heavy period to plan an ordinary-price test.
Set the minimum detectable effect. This is the smallest improvement you want the experiment to reliably detect. Don't choose an optimistic effect merely because it produces a convenient sample requirement.
Calculate sample size and duration. Use a calculator suited to your metric, entering the baseline, target effect, significance threshold, and desired power. Estimate duration from eligible traffic reaching each version, not total store traffic.
Configure simultaneous random assignment. Keep traffic sources, dates, product, and price comparable, and preserve each visitor's assignment. Don't change the ad audience midway through the experiment.
Validate a new setup with an A/A check. Send the groups to identical experiences to inspect assignment, tracking, and metric variability. Don't expect identical observed results, and don't assume a single clean check proves the system is flawless.
Record the stopping and decision rules. Specify when analysis happens, what sample is required, and how you'll handle technical failures or serious harm. Don't leave the team free to end the test when the graph becomes appealing.
Make the plan executable
A launch-ready document names the audience, hypothesis, page versions, event definitions, allocation, sample requirements, duration, and analysis method. It should also identify guardrail metrics, outcomes such as revenue or checkout errors that could prevent rollout despite a primary-metric improvement.
For more on separating page comparisons from combinations of changes, see Landra on landing page test design.
This video provides another way to follow the experiment-design process.
Pitfalls That Create False Winners
Opening the dashboard isn't the mistake. Stopping because today's result looks significant is. A peer-reviewed review of online experimentation identifies continuous monitoring, early stopping, insufficient samples, and multiple comparisons as causes of false winners; it reports that comparing 15 variants can raise false-positive probability to about 51% in the setup it discusses.
Separate monitoring from statistical decisions
With fixed-horizon testing, you analyze according to the sample and duration requirements chosen beforehand. With sequential testing, you use a statistical method specifically designed to support interim decisions while controlling error rates. Refreshing a conventional dashboard doesn't turn a fixed-horizon test into a sequential one.
Operating rule: Monitor whether the experiment is working every day. Decide whether the variant works only when your statistical procedure permits it.
Several less obvious mistakes can undermine an otherwise sensible comparison:
- Subgroup fishing. If a win appears only after exploring device types, age bands, and traffic sources, treat it as a new hypothesis to confirm. Predeclare decision-relevant segments and plan their sample requirements.
- Mixed exposure. If returning visitors switch versions, you can't cleanly connect their behavior to an assigned experience. Use persistent user-level assignment where possible, and prevent retargeting journeys from overriding it.
- Tracking breaks. If a purchase event fires differently between pages, the comparison measures instrumentation as well as shopper response. Reconcile events against orders and investigate discrepancies before interpreting performance.
- Novelty effects. A striking redesign may temporarily attract attention without supporting durable buying behavior. Plan representative business cycles and inspect whether the effect changes over time.
- Metric switching. If purchases don't improve but scroll depth does, don't redefine success. Report the declared primary outcome first and label exploratory findings clearly.
A broken checkout or uncontrolled spending may justify an operational stop. Document that interruption as such rather than presenting it as a completed statistical finding. Protecting customers and budget doesn't require pretending an unfinished experiment answered the original question.
Landing Page and Ad Test Examples
Say a skincare brand sends cold Meta traffic to a product page with a polished hero image and a price. Visitors leave without exploring the offer. The marketer suspects the page asks for a purchase before explaining why the product belongs in the shopper's routine.
The control keeps the existing product-led opening. The variant leads with the reader's problem and then explains the product's relevance, using substantiated claims rather than invented testimonials. Add-to-cart rate is the planned primary metric, with purchase behavior and revenue monitored as guardrails.
Example A/B tests for landing pages and ads
| Element tested | Control (A) | Variant (B) | Primary metric |
|---|---|---|---|
| Landing page headline | Product name and main benefit | Reader's problem stated first | Add-to-cart rate |
| Advertorial opening | Brand origin story | Substantiated customer result in the first line | Purchase conversion rate |
| Hero image | Product on white background | Product in use | Add-to-cart rate |
| Call to action | Shop now | See if it fits your routine | Purchase conversion rate |
| Paid social ad hook | Discount offer | Problem question | Cost per acquisition |
Each row represents a separate experiment, not a bundle to launch together. If you change the headline, image, offer, and call to action simultaneously, you can evaluate the package, but you can't confidently attribute the result to the headline.
Match the change to the question
A broad hypothesis can justify a broad variant. Comparing a direct product page with an educational advertorial asks whether a different buying journey helps this audience. Comparing headline wording asks a narrower question.
Don't confuse a noticeable change with an uncontrolled change. Keep the offer and traffic comparable, and define whether you're evaluating a complete experience or isolating an element. A workflow built around test hypotheses, metrics and iteration helps keep those purposes separate.
For a paid-social experiment, the same brand could compare a discount-led hook against a problem-led question using the ad platform's experiment feature. Keep the landing experience and offer consistent, and let cost per acquisition decide the commercial comparison. More clicks alone wouldn't establish that the new hook attracts better buyers.
Run Your First Test This Week
Choose tools by the job they perform. An ad platform's built-in experiment feature handles paid-social audience comparisons; an on-site experimentation platform assigns page experiences; analytics records the outcomes. A page builder creates the material being tested, but it doesn't automatically provide a valid experiment.
Before connecting them, confirm that your setup supports persistent assignment, the intended traffic allocation, and the primary event. Check compatibility with your Shopify or Webflow store, including whether purchases can be attributed to the originally assigned page after visitors move through checkout.
Prepare the variant without changing the experiment
At Landra, you begin by pasting a product URL and can optionally add an audience and angle. Use the generated advertorial or listicle as an editable draft, then duplicate it and change only the element under test when you're running an element-level comparison. We build and launch the pages, while you retain your ads, ad creative, and test setup.
Review every draft for offer accuracy, supported product claims, working links, and mobile usability. Faster production gives you more candidates, not more evidence for any particular candidate.
Your launch checklist
- Choose the question. Record a hypothesis grounded in a real shopper obstacle.
- Confirm feasibility. Calculate sample requirements and check whether available traffic can support the decision.
- Validate measurement. Complete test purchases and confirm consistent event recording.
- Freeze the comparison. Keep ads, product, price, and eligibility rules stable.
- Assign responsibility. Name who checks technical health and who approves the final analysis.
- Commit before launch. Save the stopping rule and decision criteria before the first visitor arrives.
Starting this week doesn't mean declaring a winner this week. A useful first milestone is a functioning, documented experiment that your team can interpret clearly.
Landra turns a product URL into an editable pre-sell page, including advertorial and listicle formats, so you can prepare a meaningful variant for your next experiment. Visit Landra to build your draft, then run it against your control using your own ad and analytics setup and a predefined decision rule.