

Most advice about ad performance metrics starts in the wrong place. It treats CTR like a verdict, ROAS like truth, and platform dashboards like a full account of reality, even though those numbers are only useful when you know what layer of the funnel they diagnose. The better question isn't “Which metric is best?” It's “Which metric should win when the signals disagree?”
For DTC brands, that distinction matters because a campaign can look lively on the surface and still waste budget after the click. A strong ad can earn attention, a weak landing page can lose it, and a misleading dashboard can hide the gap until you've already scaled the wrong thing. The practical way to read performance is to separate visibility, engagement, and profitability, then decide which layer is broken.
Table of Contents
- Why High CTR Can Hide a Failing Campaign
- The Three Measurement Layers Every Marketer Needs
- Which Metrics Matter Most by Funnel Stage and Channel
- When Platform Attribution Lies to You
- How Pre-Sell Landing Pages Change the Metric Math
- Attention Quality Metrics Beyond the Click
- The Optimization Workflow That Actually Works
- Common Metric Mistakes and How to Avoid Them
Why High CTR Can Hide a Failing Campaign
A high CTR can be flattering and still mean the campaign is losing money. Clicks are only the first proof that the creative earned attention, not proof that the traffic was qualified, the page matched the promise, or the sale was profitable. That's why a dashboard that overweights CTR can push teams to optimize for curiosity instead of revenue.
Clicks are upstream, not final
The basic formulas matter here. CTR is clicks divided by impressions, conversion rate is conversions divided by clicks, CPM is ad spend divided by impressions times 1,000, CPA is spend divided by conversions, and ROAS is revenue from ads divided by ad spend, as outlined in the measuring ad performance framework. Those relationships are useful because they show where leakage starts. If CTR is healthy but conversion rate and CPA are weak, the problem is usually not awareness, it's what happens after the click.
That's also why I don't trust single-metric wins. Ad platforms are built to surface easy signals fast, but DTC brands need business outcomes, not applause from the ad set. If the campaign drives cheap clicks and expensive customers, the click metric is doing exactly what it's supposed to do, and still misleading you.
Practical rule: treat CTR as a diagnostic for relevance, not as a verdict on performance.
A good way to sanity-check any report is to ask whether the campaign is failing at visibility, relevance, or profitability. If the answer isn't obvious, the dashboard is hiding more than it's revealing. For a useful ROAS-oriented lens, the guide to ROAS reporting is a solid companion resource because it keeps the discussion centered on revenue instead of vanity.
Why this creates budget mistakes
When teams scale based on CTR alone, they often increase spend on creative that's entertaining but commercially soft. That usually shows up later as poor CPA or weak ROAS, but by then the budget has already favored the wrong pattern. The smarter move is to read CTR as one layer inside a system, then test whether the landing page and offer deserve the traffic.
The Three Measurement Layers Every Marketer Needs
The cleanest way to read ad performance metrics is to split them into three layers. This framework is widely used because it maps directly to the funnel, awareness, consideration, and conversion. It also keeps teams from mistaking a traffic problem for a profit problem.
Reach, engagement, outcome
At the top layer are reach metrics, mainly impressions and CPM. These tell you whether the campaign is getting seen at an efficient cost. A weak CPM can point to visibility issues, poor auction competitiveness, or an audience that's too narrow.
The middle layer is engagement, where clicks, CTR, and CPC live. These show whether the creative and offer are relevant enough to earn action. Message-market fit starts to surface here, but it still doesn't prove commercial value.
The bottom layer is outcome, where conversions, CPA, and ROAS sit. This is the layer that ties media spend to actual business results. In ecommerce and retail media, those are usually the most decision-critical metrics because they directly connect spend to sales efficiency, as Amazon Ads lays out in its performance guidance on ROAS and CPA.
Diagnostic framework
| Metric | Formula | Layer | Diagnoses |
|---|---|---|---|
| Impressions | Count of ad displays served | Reach | Visibility and delivery |
| CPM | Ad spend divided by impressions, times 1,000 | Reach | Cost to get seen |
| Clicks | Count of click actions | Engagement | Initial response |
| CTR | Clicks divided by impressions | Engagement | Relevance and creative pull |
| CPC | Ad spend divided by clicks | Engagement | Traffic efficiency |
| Conversions | Count of completed desired actions | Outcome | Business response |
| CPA | Spend divided by conversions | Outcome | Acquisition cost |
| ROAS | Revenue from ads divided by ad spend | Outcome | Profitability and return |
The value of this structure is operational. When a campaign underperforms, you don't need to guess which lever to pull, you identify which layer is broken and fix the highest-leverage leak first. That saves time, but more importantly, it prevents you from “optimizing” a healthy layer while the actual problem keeps draining budget.
Which Metrics Matter Most by Funnel Stage and Channel
Not every metric deserves equal weight in every campaign. A top-of-funnel awareness push on Meta shouldn't be judged the same way as a bottom-funnel ecommerce search campaign, because the user's intent is different and the platform mechanics are different. The mistake of measuring every campaign with the same final-scorecard metrics is common.

Funnel stage changes the metric hierarchy
For awareness, impressions and reach matter because the job is to create exposure. For consideration, CTR, CPC, and engagement quality matter because you're testing whether the message is persuasive enough to earn deeper interest. For conversion, CPA, ROAS, and conversion rate matter because now the question is whether the traffic becomes revenue.
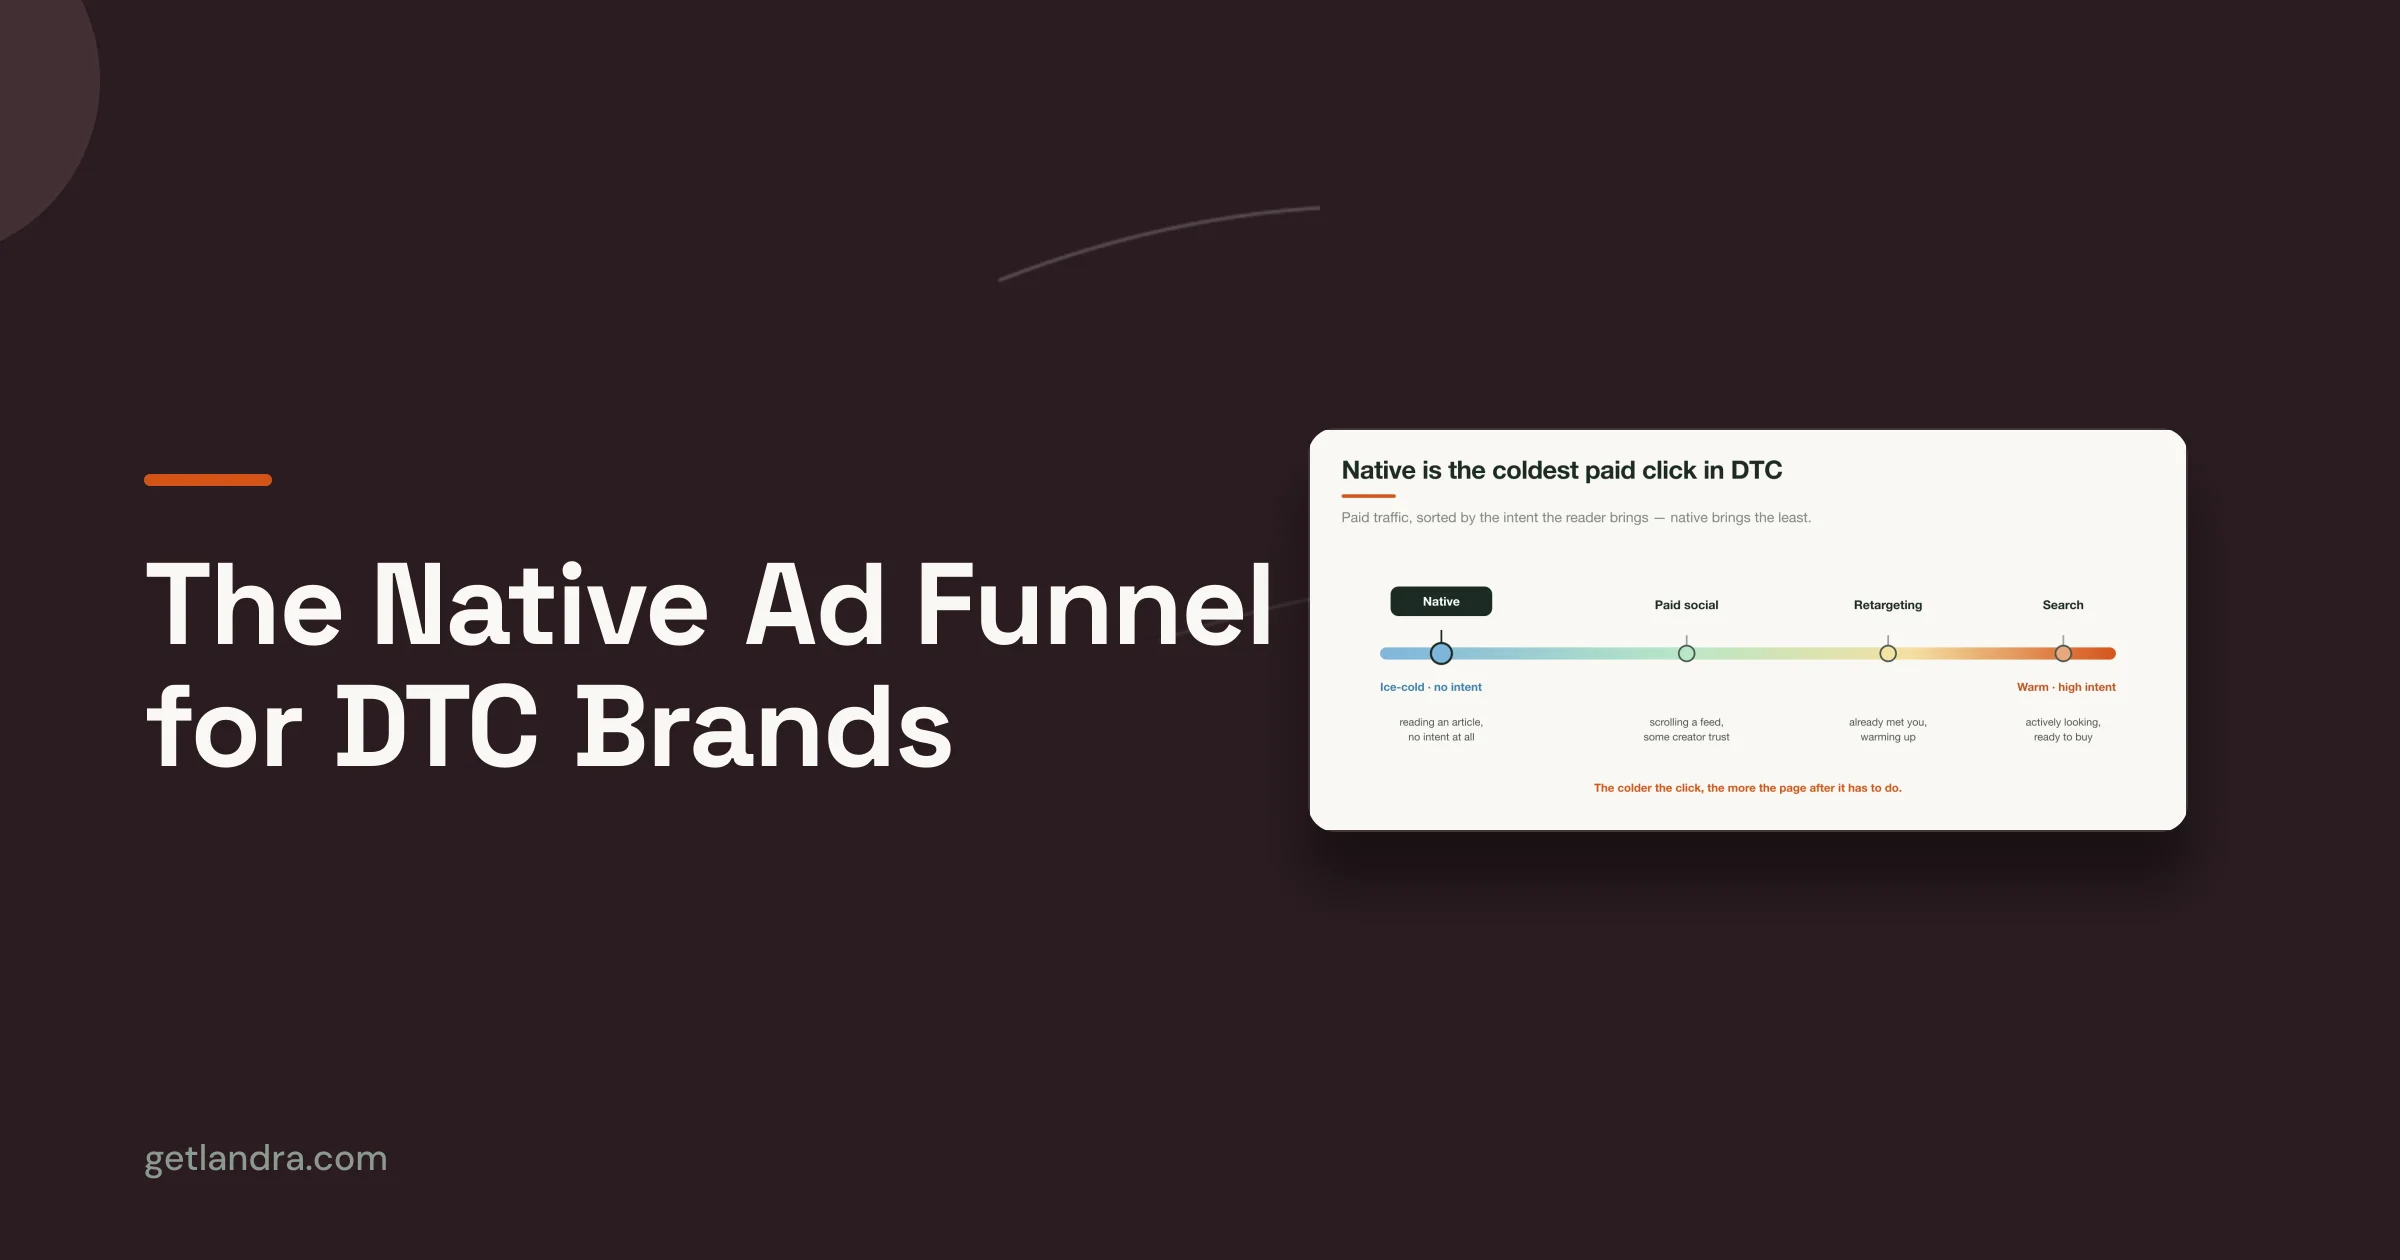
That logic becomes especially important on Meta and TikTok, where the feed rewards fast attention but not always durable intent. On Google, user intent is usually closer to the purchase moment, so outcome metrics tend to matter earlier. On social, a stronger creative can earn a lot of clicks from people who aren't ready to buy, which is why engagement can look healthy while sales lag.
A practical DTC decision rule
Use this ordering when you're choosing the primary metric:
- Awareness campaigns: prioritize impressions and reach.
- Education campaigns: prioritize CTR and engagement quality.
- Direct response campaigns: prioritize CPA and ROAS.
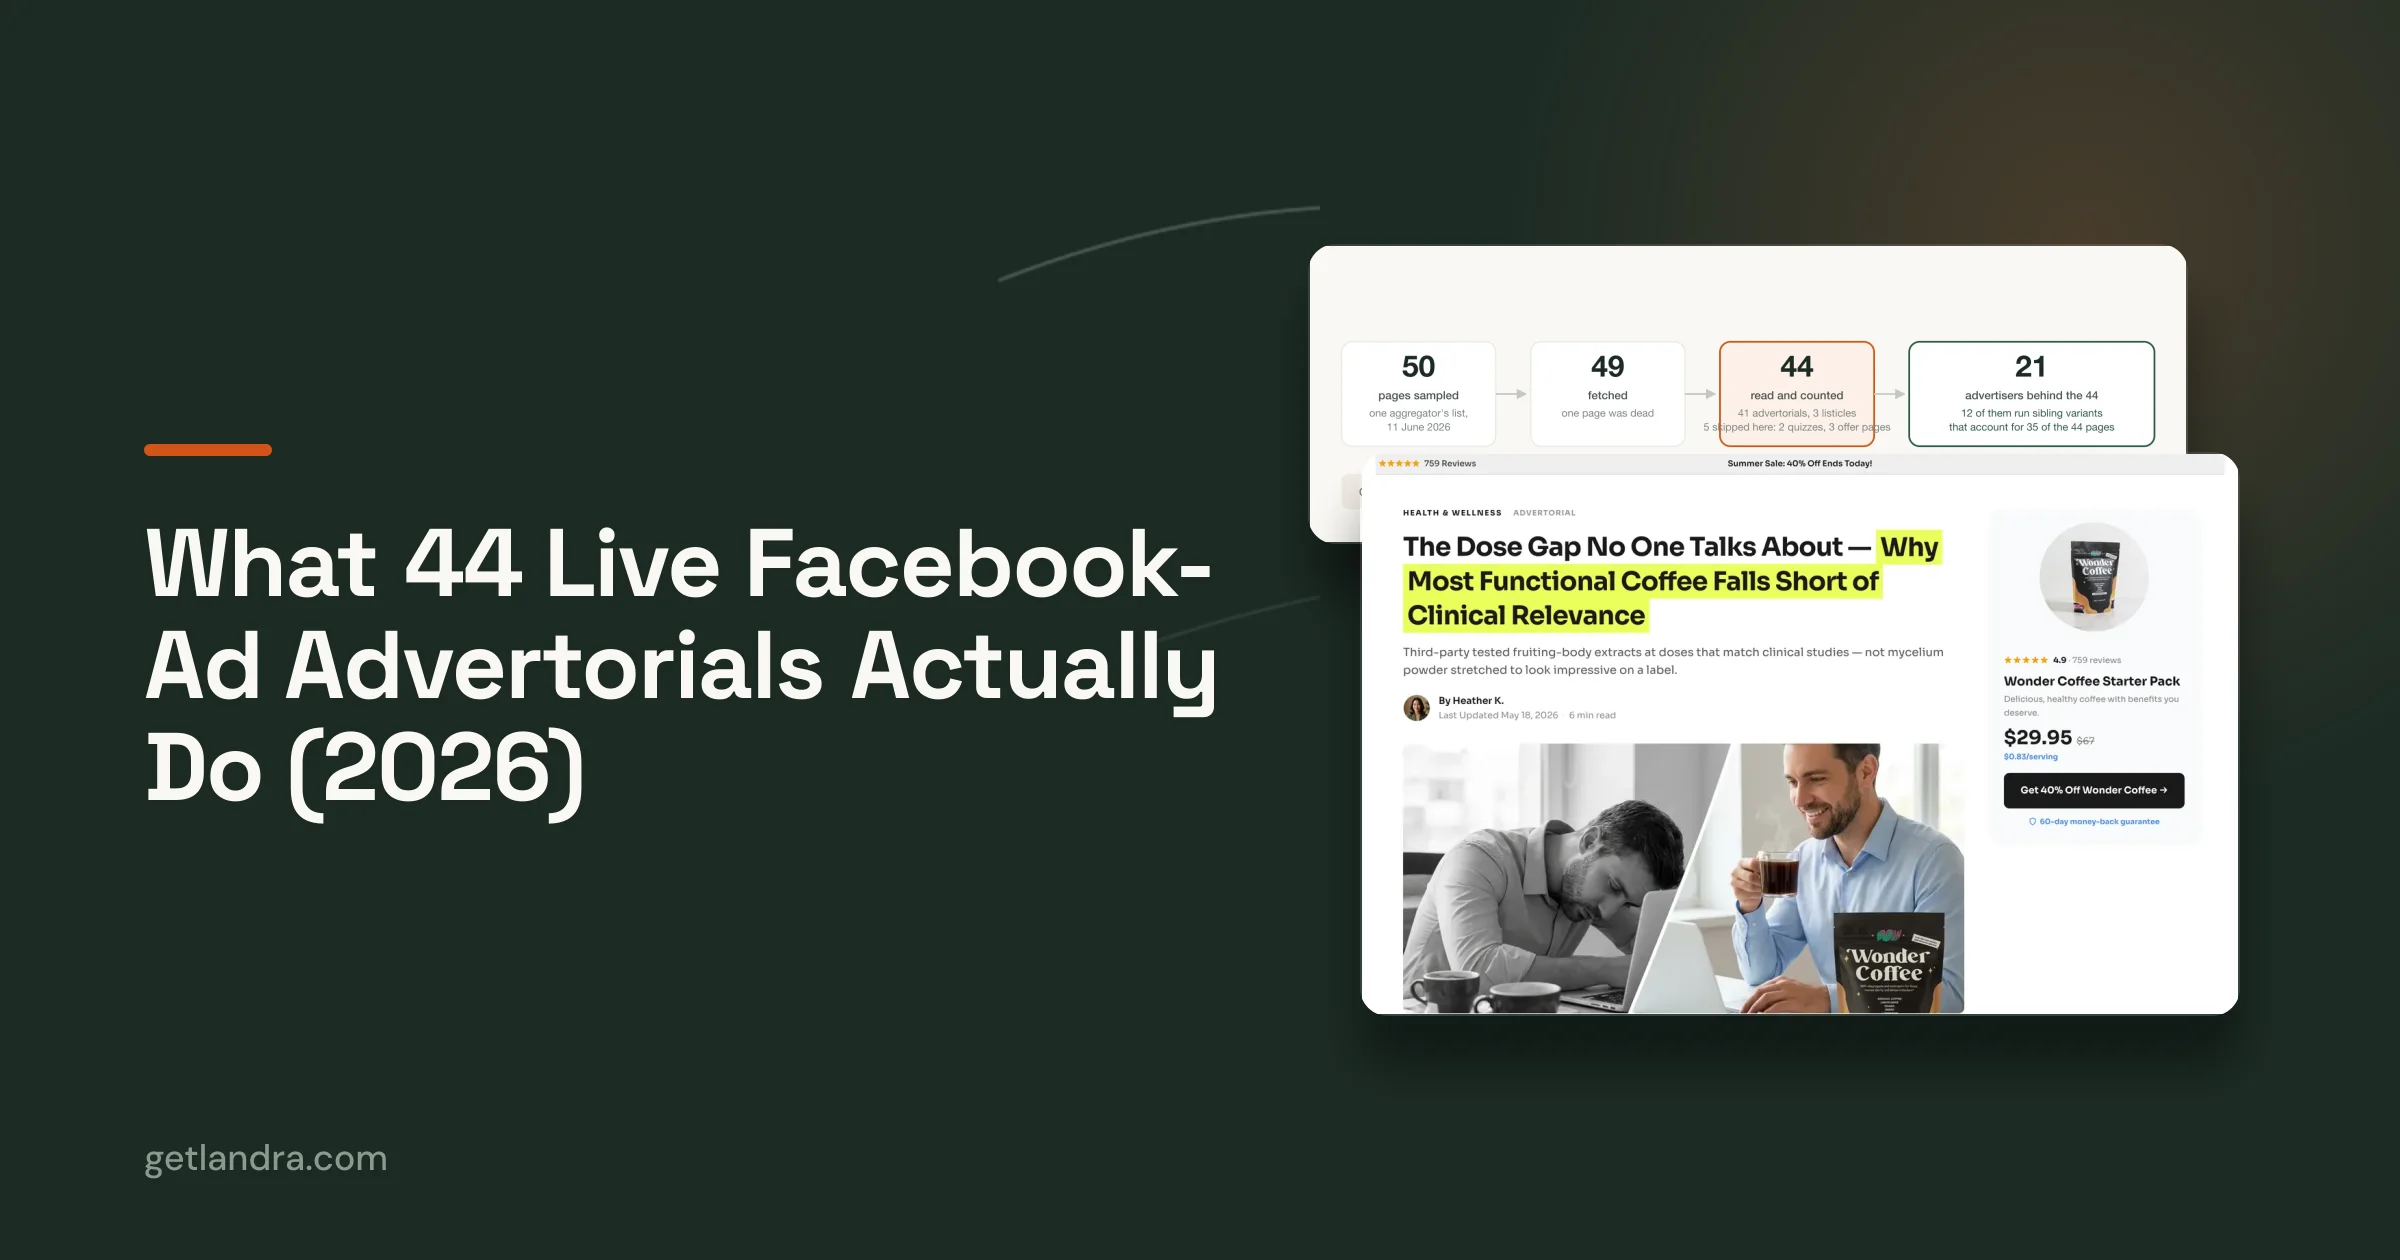
- Cold traffic to advertorial pre-sell pages: add landing page view rate, click-through to product page, and on-page engagement before judging final purchase outcomes.
For teams building funnel logic, the sales funnel digital marketing guide is useful because it frames metrics by intent stage instead of by dashboard row. That matters when your traffic is cold and the first conversion is attention, not purchase.
When the funnel stage changes, the metric that matters most changes with it.
If you're testing pre-sell pages, don't let a weak immediate purchase rate fool you into killing the concept too early. Cold traffic often needs a warm-up step, and the right question is whether the page is creating qualified intent before the buy signal shows up.
When Platform Attribution Lies to You
Platform ROAS is useful, but it's not the whole truth. Click-based attribution can break when conversions are delayed, journeys are multi-touch, or privacy changes limit what the platform can observe. That's when the dashboard and the business side start telling different stories.
Trust the metric that matches the decision
If platform ROAS and Shopify revenue disagree, the first task is not to pick a favorite dashboard. It's to ask what each system is measuring. Platform data is usually better at short-term click credit, while business-side data is better at actual revenue and customer acquisition cost.
That's why attribution should be treated like a modeling problem, not a faith test. A useful attribution modeling guide will help you frame the issue correctly, but the practical rule is simple. When the campaign is optimized for immediate purchase and attribution is stable, platform ROAS can be a useful input. When journeys are longer, data is delayed, or multiple touches are involved, business-side CAC and revenue reconciliation should override the platform score.
Pre-sell campaigns need a different lens
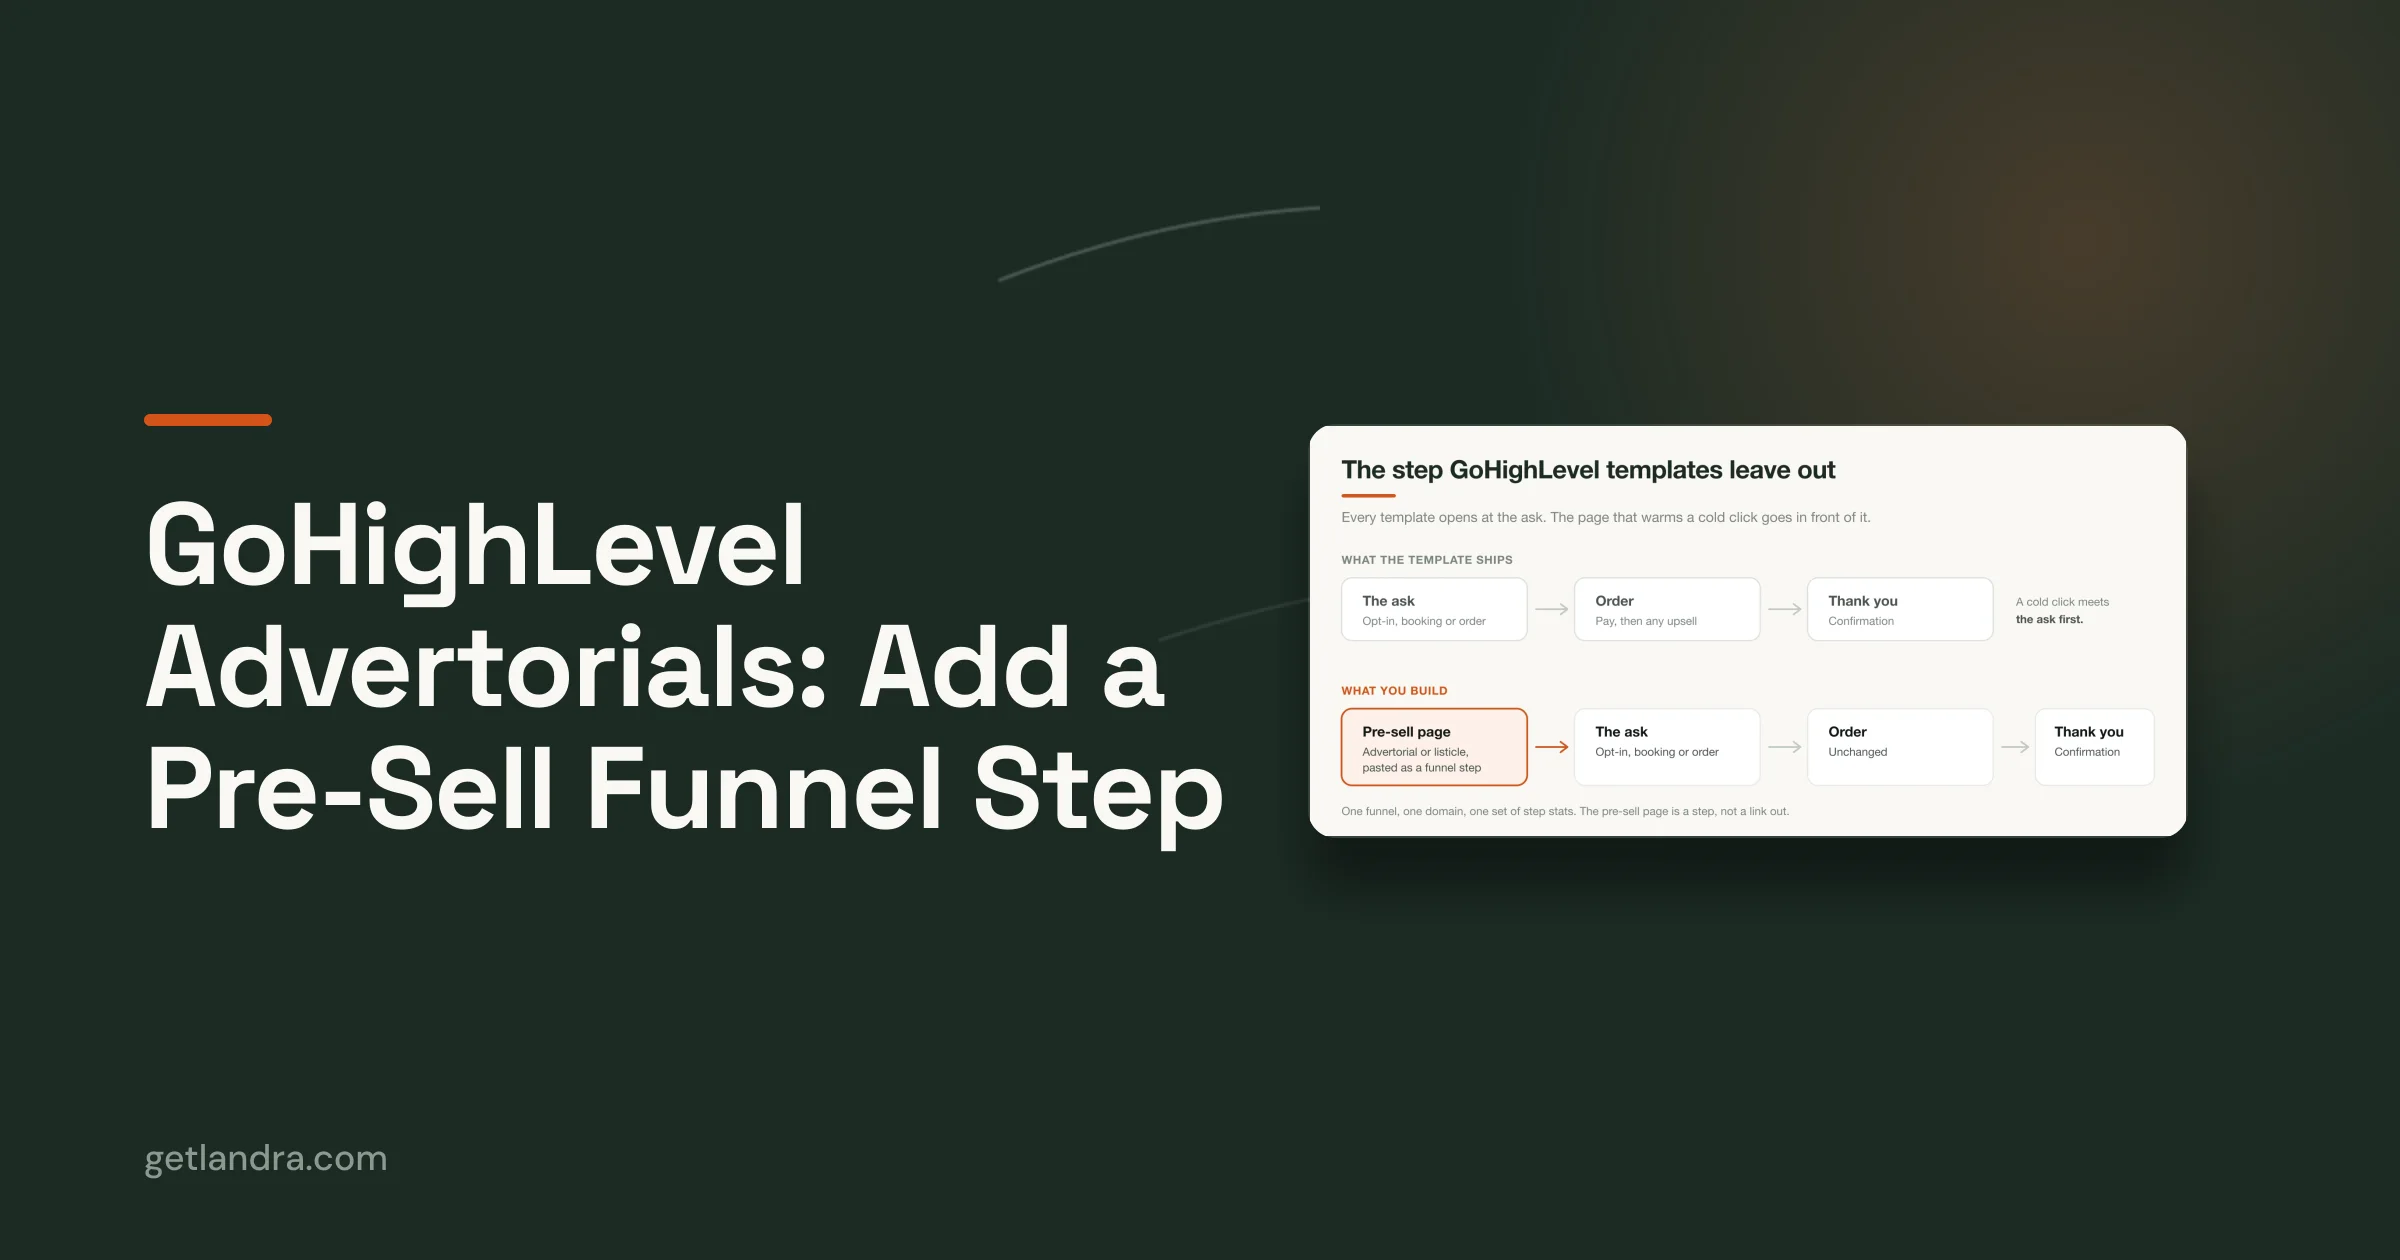
Pre-sell traffic complicates the picture even more. If a cold click goes to an editorial landing page first, then a product page later, the platform may over-credit the first click while undercounting the supporting touches that made the sale happen. In that case, the most honest primary metric is often the one closest to the actual bottleneck, which may be landing page conversion rate or downstream purchase rate depending on the campaign design.
Decision rule: if the platform says the campaign is winning, but business-side revenue doesn't confirm it, trust the business-side number.
A lot of DTC teams overreact here. They pause campaigns because platform attribution looks weak, even though the traffic is producing real customers after a longer path. The fix is not to ignore attribution, it's to choose the metric that matches the sales cycle and the quality of the traffic.
How Pre-Sell Landing Pages Change the Metric Math
Sending cold traffic straight to a product detail page and sending it to a pre-sell page are not the same test. The first asks people to buy before they're warmed up. The second asks them to engage with the argument first, then buy after the promise is clearer. That changes which ad performance metrics deserve attention.

What the page changes
On a product page, the main question is whether the page can close. On a pre-sell page, the main question is whether the page can build purchase intent without distracting the visitor. That means the diagnostic focus shifts away from immediate checkout behavior and toward page engagement signals like scroll depth, time on page, and click-through to the product page.
Landra's site reports that routing cold traffic through a pre-sell page can produce 2-3x higher conversion than PDPs for cold traffic, and also cites a 46% CAC reduction in a first-party test. Those are useful directional signals, but the mechanism matters more than the headline. Pre-sell pages reduce distraction, align the page with the ad promise, and give cold traffic a better argument before asking for the sale.
For a practical conversion benchmark calculator, the conversion rate calculator is a handy tool when you're comparing direct-to-PDP versus pre-sell paths. It keeps the discussion on rate quality instead of raw clicks.
What to track instead
When you test pre-sell against direct-to-PDP traffic, prioritize different signals at each step:
- Page fit: Does the landing page continue the ad's promise cleanly?
- Intent depth: Do people scroll, stay, and move toward the offer?
- Bridge behavior: Do visitors click through to the product page?
- Final economics: Does the path lower CAC or improve ROAS after enough data accrues?
One more point matters here. A pre-sell page can look weaker on pure speed-to-purchase, but still win on net acquisition cost. That's why direct page comparison without context produces bad decisions. The right question isn't which page converts fastest, it's which page creates the best economics for the traffic source and creative angle.
You can see the mechanics clearly in the embedded walkthrough below, where the page format changes the buying path rather than just the visual treatment.
Attention Quality Metrics Beyond the Click
For video-heavy Meta and TikTok campaigns, clicks can be a flimsy proxy for what happened. A video can earn attention, communicate the angle, and move people closer to purchase without producing an immediate click. That's why performance needs an attention quality lens, not just a traffic lens.

What clicks miss
The metric stack gets more useful when you add viewability, completion rate, engagement rate, reach, and frequency. Those measures help show whether the ad was actually seen and understood, not just clicked. The broader ad analytics view from Improvado's advertising analytics overview reflects that shift, especially for campaigns where exposure quality matters as much as downstream action.
This is especially relevant for educational pre-sell pages. If the goal is to create qualified attention before purchase, then a cheap click that bounces immediately is worse than a slightly more expensive click from someone who consumes the argument. Engagement becomes evidence that the message is landing.
Practical signals to watch
- Viewability: Was the ad on screen long enough to matter?
- Completion rate: Did people stay with the creative through the full message?
- Frequency: Are the same people seeing the same ad too often?
- Engagement rate: Are viewers interacting in a way that suggests real interest?
When the same audience sees the same creative too many times, frequency can rise while performance erodes. When creative fatigue sets in, the click can stay deceptively steady even as attention quality drops. That's why short-form video campaigns need more than click reporting, they need context around how the message was consumed.
The heat maps guide is also useful here because it gives you a way to see where attention pools on a page after the click. For pre-sell pages in particular, attention on-page is often the bridge between a view and a sale.
Good performance on educational traffic means qualified attention first, conversion second.
If you're judging a pre-sell campaign by clicks alone, you're missing half the story. The test is whether the creative is creating enough attention density to make the landing page work harder, not whether it extracts the fastest possible click.
The Optimization Workflow That Actually Works
When a campaign underperforms, many teams jump straight to the loudest number in the dashboard. That's usually the wrong move. The better workflow starts at the most critical diagnostic point and moves downward until you find the leak.

Work from visibility to profitability
Start with visibility. If impressions are weak or CPM is unusually high, the issue is often audience fit, auction pressure, or creative delivery.
Move to engagement. If CTR is low but CPM is acceptable, the ad probably isn't resonating with the audience it reached.
Then check traffic quality. If clicks are happening but landing page views or on-page behavior are poor, the promise and the page don't match, or the page itself is too slow or confusing.
Finally, assess results and efficiency. If conversion rate is weak, the offer or page is failing. If CPA is high or ROAS is poor, the campaign may be attracting the wrong traffic or selling into a weak margin structure.
Fix the right layer first
A simple troubleshooting map works well in reviews:
- High CPM, low CTR: fix audience targeting or creative relevance.
- Strong CTR, weak conversion rate: fix landing page alignment.
- Good conversion rate, weak ROAS: check pricing, margin, and product economics.
- Platform ROAS strong, business-side revenue weak: reconcile attribution before scaling.
The biggest mistake is optimizing a lower layer while the true problem sits above it. I've seen teams rewrite landing pages when the issue was audience mismatch, and I've seen them chase new creative when the page was failing to carry the click. That's how budget gets burned without a clear lesson.
Common Metric Mistakes and How to Avoid Them
The worst metric errors are rarely technical. They're judgment errors. Teams see a number move in the right direction and assume the whole campaign is healthy, even when the downstream data says otherwise.
The errors that cost the most
One common mistake is optimizing for CTR without tracking post-click behavior. The symptom is lively traffic and disappointing sales. The root cause is usually message mismatch or weak landing-page follow-through, and the fix is to inspect landing page view rate, conversion rate, and CPA before celebrating the click.
Another mistake is comparing ROAS across campaigns with different attribution windows. That makes short-window campaigns look cleaner than they are and long-window campaigns look weaker than they are. The fix is to standardize measurement before you compare performance.
A third mistake is ignoring frequency until creative fatigue wrecks results. When the same audience sees the same ad too often, engagement falls off even if the dashboard still looks busy. The fix is to monitor delivery patterns and rotate creative before the audience gets numb.
For more on how neglected engagement can spill into revenue loss, Exerta's breakdown of the cost of unanswered Meta ad comments is a useful reminder that public response quality is part of the performance equation too.
Metric hygiene checklist
- Consistent attribution windows: Compare like with like.
- Business-side revenue tracking: Validate platform data against actual sales.
- Frequency monitoring: Watch for fatigue before performance drops.
- Post-click behavior: Check landing page engagement, not just clicks.
- Revenue reconciliation: Review dashboard data against first-party records regularly.
Clean reporting doesn't make ads better by itself, but it keeps you from making expensive false conclusions. The teams that scale profitably are usually the ones that trust the right metric for the right decision, then move fast on the actual bottleneck.
If you're building pre-sell pages, Landra helps DTC teams turn a product URL into a mobile-first advertorial or listicle fast, then test the page against the metrics that matter. Visit Landra if you want to ship better pre-sell experiences, read the right signals faster, and stop scaling campaigns off misleading dashboards.