
You closed Ads Manager feeling fine. Meta spent about $12,000, the dashboard showed a $40 cost per result, and the instinct was to raise the budget. Then finance asked why cash got tighter while that number improved. The platform counted media against its own conversions. Your bank counted creative, fees, and salaries against people who had never ordered before.
How to calculate CAC is that division, done on a cohort you can defend. Fully loaded cost, contribution margin, repeat orders, and attribution can reverse a budget call that looked obvious in the ad account.
Table of Contents
- The CAC Formula With a Worked Example
- How to Calculate CAC Step by Step
- Simple CAC Calculator and First Check
- Blended, Paid and Incremental CAC Compared
- Payback and the Errors That Flatter CAC
- Benchmarks to Judge Your CAC Against
The CAC Formula With a Worked Example
Say those 300 results really were first-time buyers. $12,000 ÷ 300 = $40. That is media-only CAC. It answers what the auction charged you, not what the customer cost the business.
CAC = total acquisition cost ÷ new customers acquired in the same period. A plain walk-through of the customer acquisition cost formula explained is worth keeping beside the calculator, because the errors sit in the numerator, not in the division.
What goes into the total
Build the numerator from the invoices, not from the ad account:
- Paid media: the $12,000 on Meta, plus any other paid channel in that month.
- Creative production: editors, UGC fees, and design. Call it $3,000.
- Agency fees: media management for the month, $1,500.
- People: commissions, plus the share of marketing salaries spent winning new buyers rather than running the brand. Say $2,500.
- Software: the acquisition share of the ad ops and creative stack.
That is $19,000, not $12,000.
Who counts as a customer
The denominator is new customers only. Not orders, revenue, clicks, or repeat buyers who clicked an ad. If 40 of those 300 purchases were returning customers, the denominator drops to 260 and the cost per new buyer jumps. Hold the example at 300 first-time buyers so the comparison stays clean.
$12,000 ÷ 300 is $40. $19,000 ÷ 300 is about $63.
Same ads, same buyers, different decision. A $40 cost can look workable on a modest first order. About $63 on that same order does not, unless those people come back and the margin is real.
Write both numbers on paper before you open a spreadsheet. If you can't name every line inside the $19,000, the sheet will only make a thin numerator look precise.
How to Calculate CAC Step by Step
A blended figure is only as good as the window behind it. I would take a slightly late cohort number over a pretty weekly one that mixes last month's spend with this week's orders.
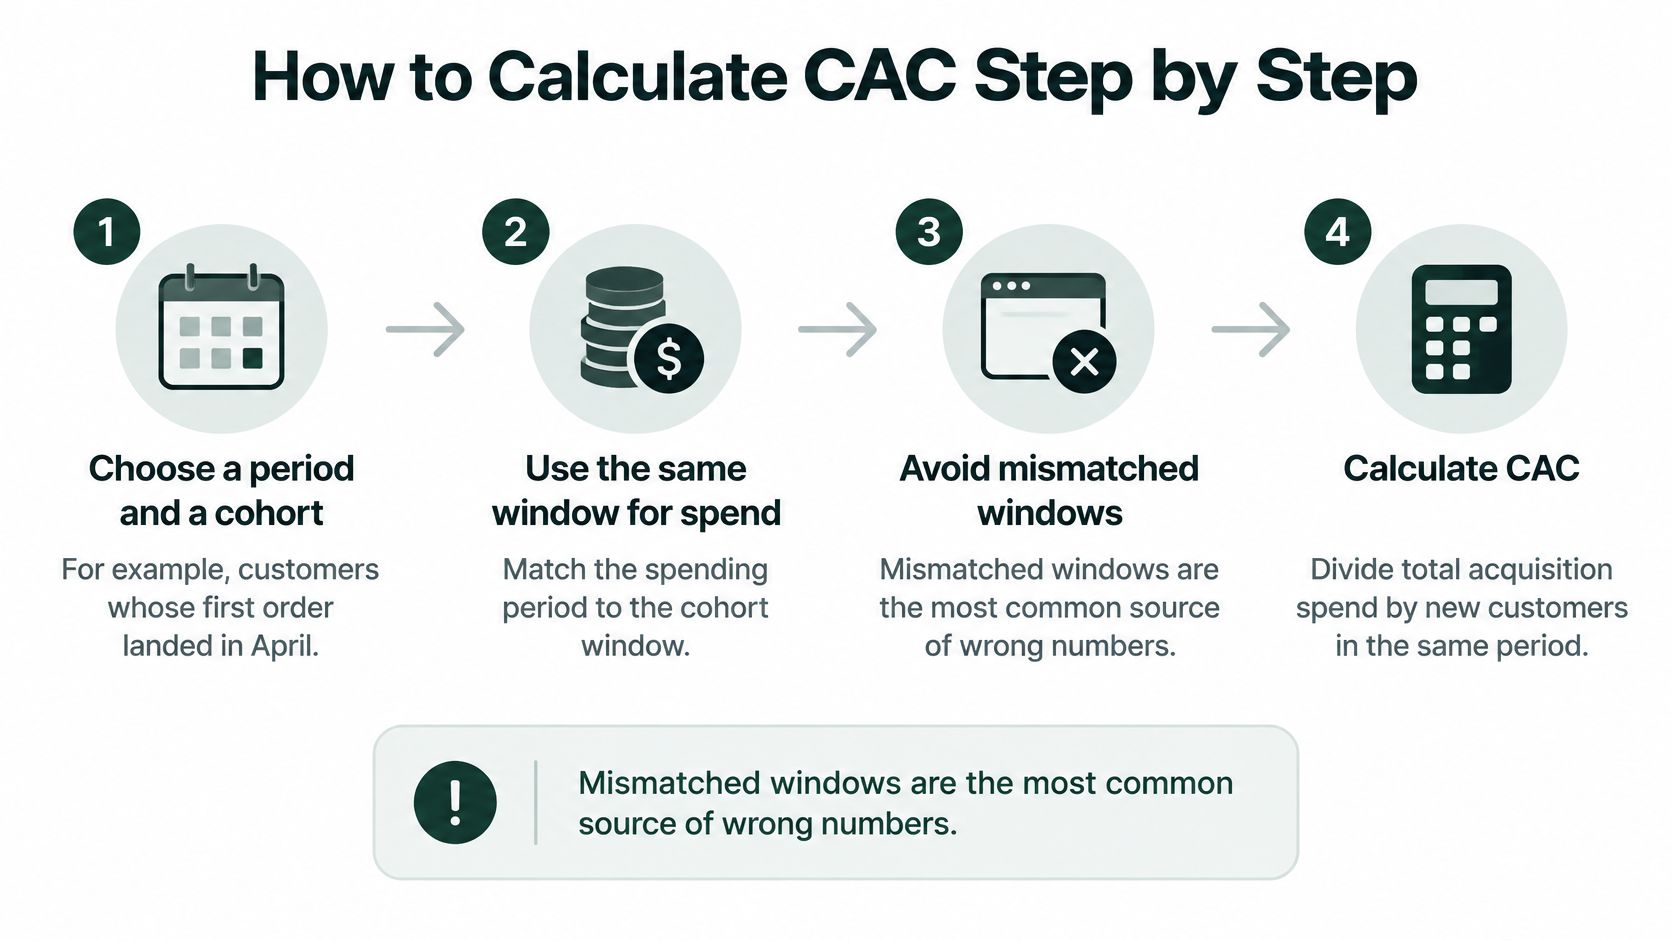
1. Pick the period and the cohort together. Use customers whose first order landed in April, and pull spend for that same window. Mismatched windows are the most common source of a wrong CAC, because a campaign can spend on Monday and convert the following week.
2. Add every acquisition cost in that window. Start with the ad platforms, then invoices for creative, agencies, and commissions, plus the acquisition share of payroll and software. A FounderPath breakdown of SaaS KPIs states the fully loaded form directly. Total sales-and-marketing acquisition cost divided by new customers, and a $120,000 spend that produces 600 first-time customers is a blended CAC of $200. The denominator is new customers, not orders, revenue, clicks, or purchasers that include repeat buyers.
3. Count first-time customers in Shopify. A landing-page conversion isn't a customer. When you route otherwise similar paid-social traffic to a product page versus an advertorial or listicle, compare first-order customer counts, not page conversions.
4. Divide. Fully loaded cost ÷ new customers. That is the business number for the window.
5. Split it by channel. Give Meta, TikTok, email-assisted paid conversions, and affiliates only their own spend and their own new customers. Say the blend is that $200, Meta's new customers cost $260, and email-assisted paid conversions cost $30. The average looks acceptable while one channel is expensive. Teams who already itemize sales and marketing costs per SaaS customer know this trap. One blended line lets the cheap channel cover for the costly one.
6. Reconcile the platforms to Shopify. Platform-reported conversions usually run high. Treat them as directional and check them against Shopify orders and first-party analytics. A holdout, a geo test, or a clean pre/post read tells you whether the platform invented customers the business didn't gain.
7. Lock a conversion window and reprocess later. Weekly CAC is noisy when spend lands before orders. Report on the window, then update the cohort when delayed orders post.
Practical rule: Fully loaded CAC should always sit above media-only CAC. If it doesn't, a cost category is still missing.
Simple CAC Calculator and First Check
You need a number you trust enough to act on, not the lowest figure the dashboard will print.
Inputs
- Total acquisition spend for one window. Paid media, creative, agency fees, commissions, the acquisition share of marketing salaries, and software.
- New first-time customers in that same window, from Shopify, with returning buyers excluded.
CAC = total acquisition spend ÷ new customers.
Using the founder month, $19,000 ÷ 300 = $63.33. Run it again per paid channel, that channel's spend over its new customers, and set each result next to the blend. The outputs worth keeping are blended CAC, channel CAC, the gap between media-only and fully loaded (fully loaded must be higher), and payback in months once you enter contribution per customer.
A 30-day first check
Pull the last 30 days of spend and first-time customers. Calculate fully loaded blended CAC, compare each paid channel with it, then compute payback by cohort. Set the ceiling from cash runway, not from a generic benchmark you found in a thread.
While you are in the numbers, pair CAC with the conversion metrics worth tracking in 2026, especially landing-page conversion rate and refund rate. A cheaper CAC that comes with worse orders isn't a win. If you want a fast read on the page itself before you touch the media budget, our free Headline Analyzer, Conversion Rate Calculator, and Compliance Checklist sit outside the ad account and take a few minutes.
Blended, Paid and Incremental CAC Compared
Four versions of the same month can point four different ways. Calculate all four on one period before you move budget.
| Version | Formula | What it shows | Use it for |
|---|---|---|---|
| Reported (platform) CAC | Platform spend ÷ platform-attributed customers | Fast read from the ad account | Daily pacing and creative tests |
| Blended fully loaded CAC | All acquisition cost ÷ all new customers | Business-level acquisition health | Monthly budget decisions |
| Paid CAC | Paid-channel cost ÷ paid-acquired new customers | Comparison between paid channels | Shifting budget between Meta, TikTok, and search |
| Incremental CAC | Spend ÷ customers the spend caused (holdout or geo test) | True causal cost of acquisition | Deciding whether to scale a channel |
Reported CAC moves fastest and is the right dial for pausing a creative today. Blended fully loaded CAC is the monthly health check. Paid CAC is how you rank Meta against TikTok against search without letting email flatter the average. Incremental CAC asks how many customers the spend caused, measured with a holdout, a geo test, or a pre/post comparison where you can run one.
Say platform CPA falls from $45 to $38 while blended CAC rises from $190 to $215 because email stopped converting. The ad account looks healthier. The business got worse. A falling CPA can sit next to a flat or rising cost of a real new customer.
A presell page can lift the conversion rate of traffic you were already buying without creating new demand. That is why it needs an incrementality read, not only a better on-platform CPA. If you compare attribution models for DTC, treat channel CAC as a model output, not a fact.
Put one row per period in the report. Spend, new customers, platform-attributed orders, blended new customers, contribution margin, and measured lift. If lift isn't on the row, you don't yet know whether to scale.
Payback and the Errors That Flatter CAC
CAC without contribution is a cost, not a decision. Convert it before you call a campaign a winner, and optimize paid social acquisition spending against recovery speed rather than against the prettiest CPA.
Turn CAC into months
Step 1. Compute first-order contribution. Subtract product cost, fulfillment, payment processing, discounts, returns, and other variable service costs from revenue. What remains is what can repay acquisition.
Step 2. Payback in months is CAC ÷ monthly contribution profit. For recurring revenue, the standard form is CAC ÷ (monthly revenue per customer × gross-margin percentage).
Step 3. Compare payback and retention by channel and by cohort. Reported ROAS doesn't do that job.
The Geckoboard definition of CAC payback uses contribution, not revenue. A $200 CAC with $80 of monthly contribution profit pays back in 2.5 months. A $200 first-order CAC on a $50 order with a 60% contribution margin produces only $30 of initial contribution, leaving $170 to recover through repeat purchases. SaaS-oriented references commonly describe 12 months or less as a healthy payback target, while high-performing businesses may reach roughly 5 to 7 months. A DTC brand should substitute its own cash-flow constraints and repurchase curve rather than import those thresholds.
| Scenario | CAC | Contribution per customer | Payback |
|---|---|---|---|
| Refill buyer, $80 monthly contribution | $200 | $80 per month | 2.5 months |
| One-off $50 order at 60% margin, reorders every two months | $200 | $30 first order, then about $15 per month | About 11 months after the first order (170 ÷ 15) |
| Cash-constrained brand, same $200 CAC | $200 | $30 first order | Set by cash runway, not a SaaS 12-month rule |
The middle row is the one that fools people. First-order CPA can look identical to the refill buyer, and the reorder rate is what decides whether you get the money back before the card bill.
Errors that make the number look better
Using revenue instead of margin. Dividing CAC by revenue shortens payback on paper. Divide by contribution.
Ignoring refunds and returns. They inflate contribution. Deduct them in the same cohort, not in a later "adjustments" tab nobody opens.
Averaging high-value repeat customers into new-customer CAC. That hides weak acquisition. Split new cohorts from returning buyers, and report payback by acquisition month, creative, audience, and landing experience.
Say a brand's Meta CAC looked like $35 until creative, agency fees, and team time went in, and it became $58. The $35 never had a chance of paying back on a thin first order. The $58 makes the reorder math unavoidable. A lower CAC is commercially meaningful only if contribution, refund rate, and 30, 60, and 90-day repeat revenue stay stable.
Benchmarks to Judge Your CAC Against
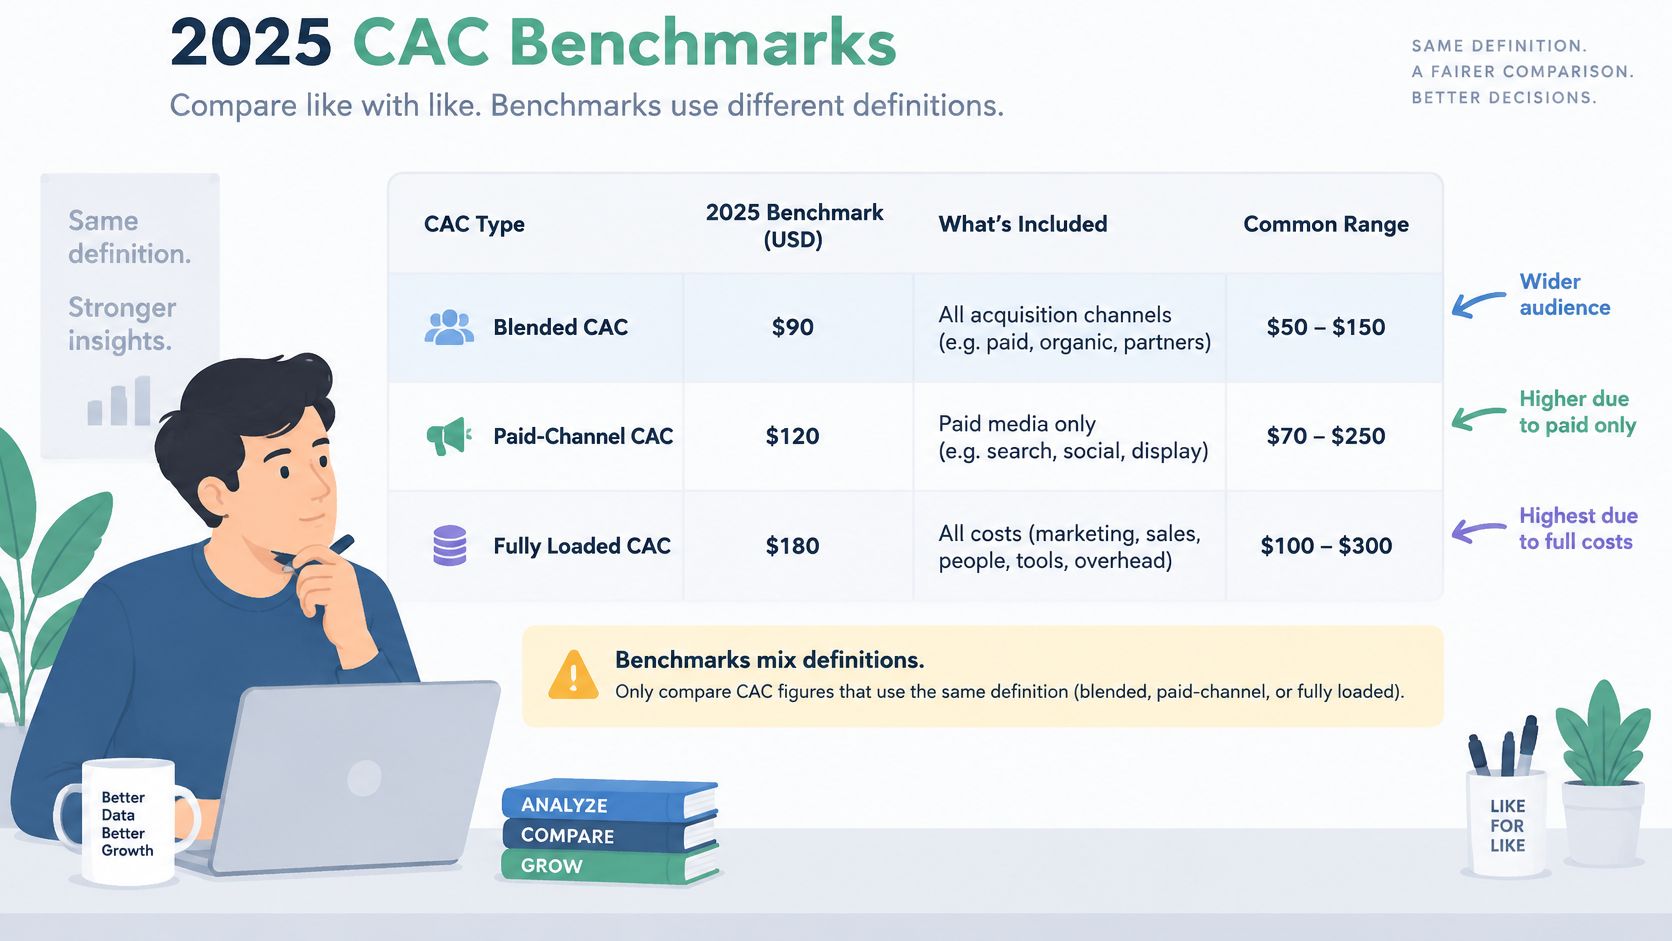
Benchmarks mix definitions. Compare a fully loaded blend with a blended reference, and a paid-channel CAC with a channel reference. Anything else is a different metric wearing the same name.
| Benchmark | Reported CAC (2025) | Source |
|---|---|---|
| B2C ecommerce average | $68 | First Page Sage via Shopify Enterprise |
| B2B ecommerce average | $84 | First Page Sage via Shopify Enterprise |
| Blended direct-to-consumer ecommerce | About $87 | Eightx benchmark compilation |
| Email and SMS | $8 to $15 | Eightx benchmark compilation |
| Meta advertising | About $53 | Eightx benchmark compilation |
In 2025, First Page Sage's benchmark report, as cited by Shopify Enterprise, put average customer acquisition cost at $68 for B2C ecommerce companies and $84 for B2B ecommerce companies. Eightx's compilation put blended direct-to-consumer ecommerce CAC at about $87, with email and SMS at $8 to $15 and Meta advertising at about $53.
Email and SMS sit far below paid social because they reach people you already have. A healthy blend depends on how much revenue comes from those owned channels. Read any of these figures next to your own margin. About $87 can be workable for a brand with a 60% contribution margin and a solid repurchase curve, and dangerous for a brand with a 20% margin and no second order.
Write your blended CAC and your Meta CAC beside these values and mark where you sit. If the gap is labor and fees rather than media, look at agency versus in-house marketing costs before you blame the auction.
Landra turns a product URL into an editable, mobile-first advertorial or listicle you can publish to Shopify, a hosted URL, or HTML, so cold paid-social traffic lands on a page built for the ad instead of a crowded product page. That test only means something if you judge it on new customers, contribution, and payback, not on a platform CPA alone. When you are ready to run the page against your current destination, start at Landra.