
Global advertising expenditure was projected to reach approximately $1.17 trillion in 2025, according to WARC's global forecast. That enormous total measures what advertisers planned to spend, not whether the customers they acquired would be profitable.
For a direct-to-consumer brand, the more useful question is smaller: How much can you pay to win a customer and still keep enough profit? The same acquisition bill can be affordable for a business with healthy margins and reliable repeat purchases, yet ruinous for one that rarely sees a buyer again.
Table of Contents
- What the Price of Marketing Really Includes
- Marketing Spend Benchmarks at a Glance
- Channel Costs and What Drives Them Up
- Calculating CAC, LTV and Break-Even Cost
- How Much Your Brand Can Afford to Spend
- In-House Team or Agency Costs Compared
- How to Lower Your Marketing Price Without Cutting Reach
- Set Your Allowable CAC Before the Next Campaign
What the Price of Marketing Really Includes
The price of marketing is the full cost of attracting paying customers and encouraging them to return. It isn't just the invoice from an advertising platform.
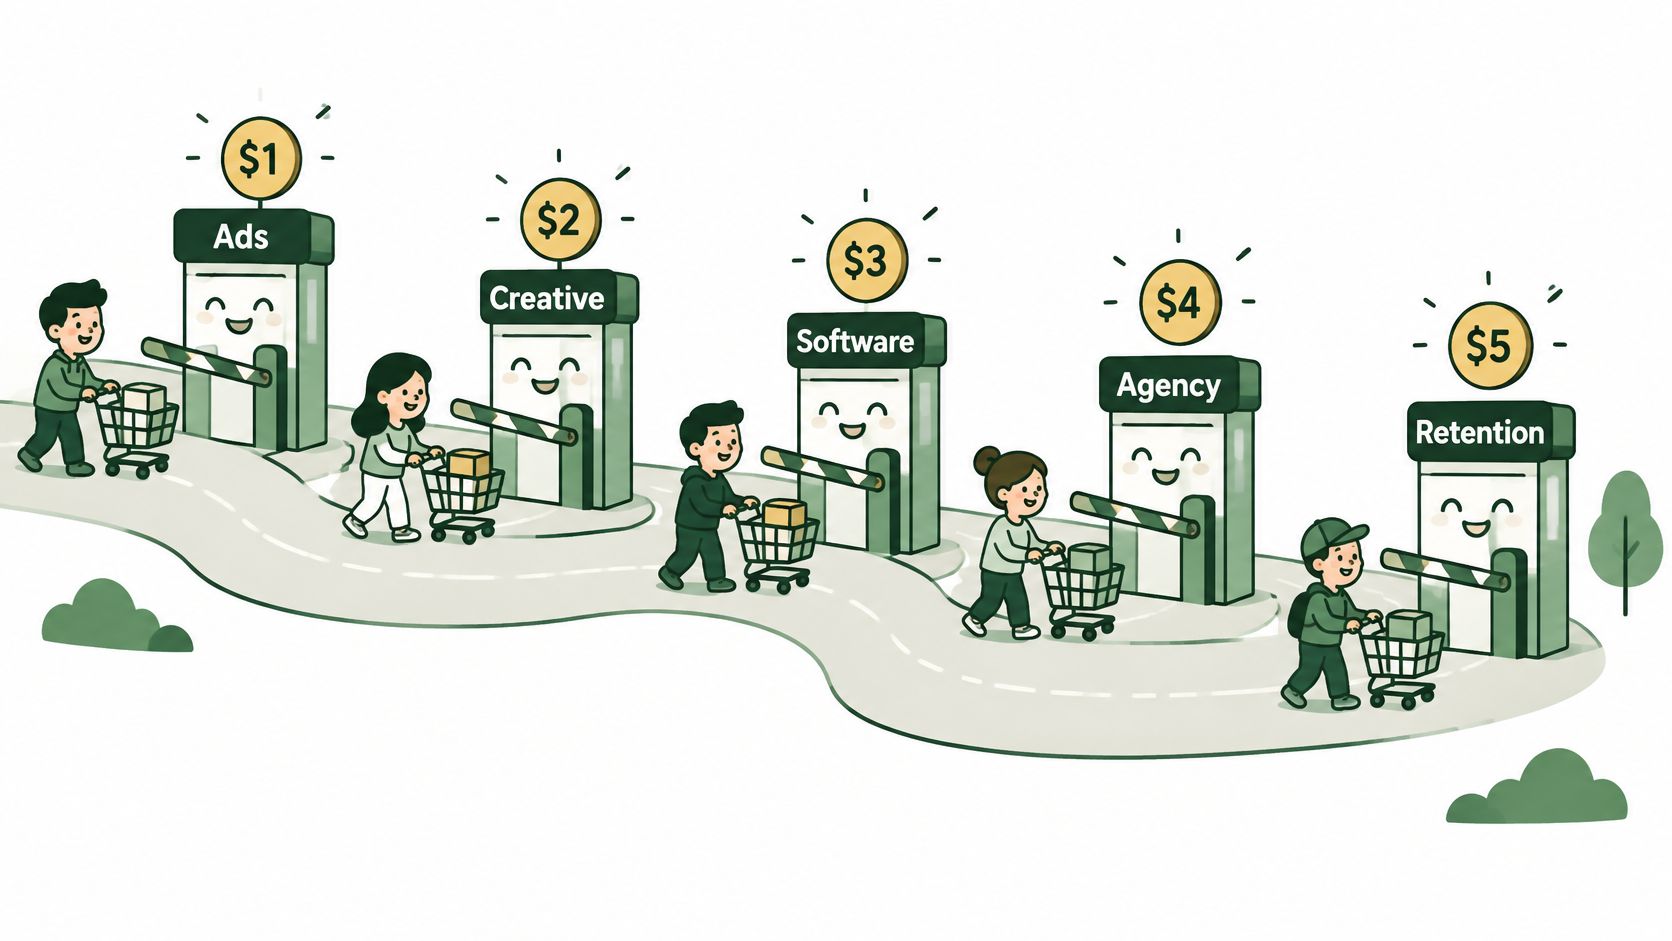
Think of acquisition as a toll gate. You pay to send potential buyers through, but only some purchase. A cheap passage doesn't help if the majority of visitors leave without buying.
Count the whole bill
Your marketing ledger needs these cost layers:
- Media spend: Payments for advertising placements and clicks.
- Creative and production: Copywriting, photography, video, design, and revisions.
- Landing pages: Building, editing, hosting, and maintaining the destination.
- Software and tools: Analytics, email, testing, attribution, and production subscriptions.
- People and agency fees: Salaries, contractors, management, and account support.
- Unsuccessful tests: Money spent learning which messages, audiences, and offers don't work.
Advertising is only part of that picture. For scale, dentsu's Global Ad Spend Forecasts forecast US$992 billion in global advertising expenditure in 2025, representing 4.9% growth. A brand's complete marketing budget also includes work that never appears in an ad account.
A platform-reported cost per acquisition generally relates advertising spend to attributed conversions. It doesn't automatically include your designer's invoice, your software subscriptions, or the employee who managed the campaign. It may also count purchases rather than exclusively new customers.
Read the cost from different angles
Monthly spend tells you the cash commitment. Cost per new customer tells you what acquisition requires. Marketing cost relative to customer profit tells you whether the commitment is economically sensible.
This illustration shows why the bill includes more than media buying.
Marketing Spend Benchmarks at a Glance
Marketing spend benchmarks from recent surveys
| Benchmark | Figure | Year | What it tells you |
|---|---|---|---|
| Gartner average marketing budget, share of company revenue | 9.1% | 2023 | The earlier comparison point |
| Gartner average marketing budget, share of company revenue | 7.7% | 2024 | Average across surveyed companies |
| Gartner paid media share of marketing budget | 27.9% | 2024 | Bought reach was only part of total spending |
| Small businesses allocating 6–10% of revenue to marketing | About 4 in 10 | 2025 | A common allocation band |
| Small businesses allocating more than 10% of revenue | About 1 in 3 | 2025 | Higher allocations weren't unusual |
| Small businesses planning to increase budgets | Nearly half | 2025 | Many respondents intended to expand |
| Small businesses planning to keep budgets unchanged | 35% | 2025 | A substantial group planned stability |
| Small businesses planning to reduce budgets | 16% | 2025 | Fewer respondents planned cuts |
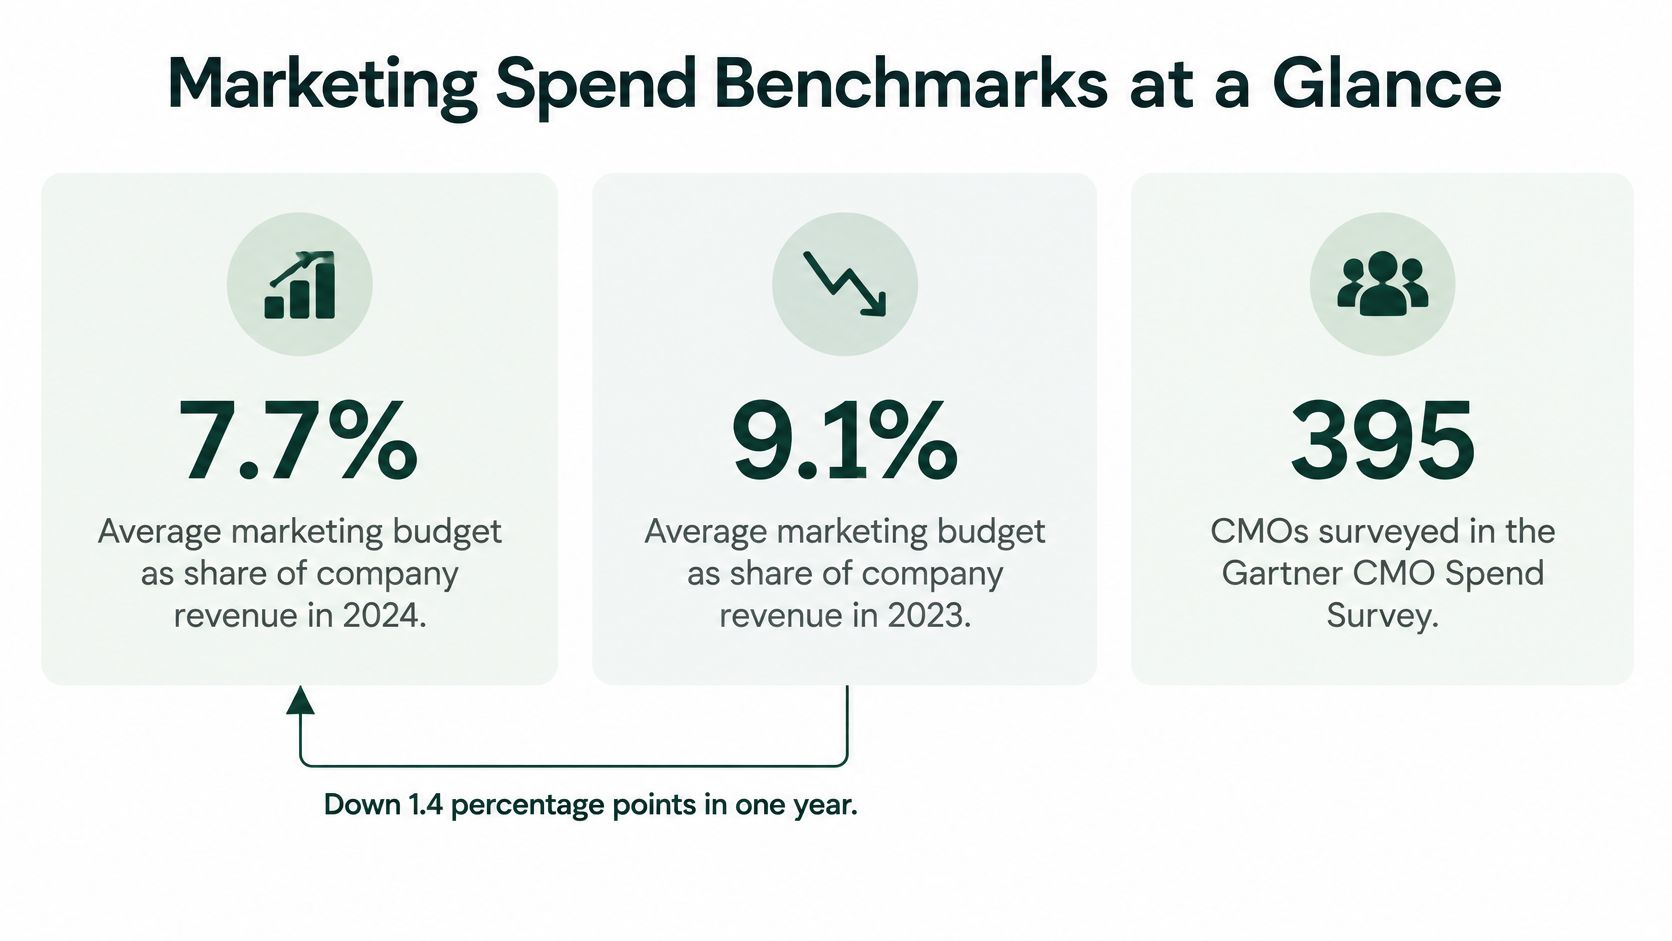
The revenue-share figures come from Gartner's survey of 395 CMOs and marketing leaders, which reported 7.7% in 2024, down from 9.1% in 2023. Paid media represented 27.9% of marketing budgets in 2024, according to the same survey as reported by Marketing Dive.
For small businesses, LocaliQ's marketing trends reporting describes roughly four in ten allocating 6–10% of revenue, about one-third allocating more than 10%, and 2025 budget intentions of nearly half increasing, 35% holding steady, and 16% reducing spending.
The visual below highlights Gartner's revenue-share comparison.
Use averages as a check, not a target
A mature brand with returning buyers can support a different budget from a launch that must introduce an unfamiliar product. Neither should copy an average without checking margins, cash availability, and acquisition performance.
Calculate your own comparable measure:
Marketing budget share = annual marketing spending ÷ annual revenue × 100
Use the same accounting period for both inputs. Then check the definition of spending: does your total include salaries, software, production, agency fees, and retention activity?
Benchmark rule: Compare matching definitions before comparing percentages.
A revenue percentage tells you the size of a commitment. It doesn't tell you whether the customers purchased with that commitment will repay it.
Channel Costs and What Drives Them Up
Channel pricing measures and their main drivers
| Channel | Pricing measure to inspect | Cost driver to watch |
|---|---|---|
| Meta feed ads, including Facebook and Instagram | Account-level CPM alongside purchase CAC | Creative fatigue and audience overlap |
| TikTok ads | Account-level CPM alongside purchase CAC | Opening hook and continued attention |
| Google Search | Keyword-level CPC alongside purchase CAC | Keyword competition and ad quality |
| Google Shopping | Product-level CPC alongside purchase CAC | Product feed quality and bid strategy |
CPM measures the price of impressions; CPC measures the price of clicks. Neither establishes the price of a profitable customer, and a universal rate card would hide differences in market, product, audience, and campaign setup.
For budgeting, use your own account history and current platform forecasts. Compare similar placements and objectives rather than treating every impression or click as interchangeable.
Separate auction prices from funnel economics
Several problems can make acquisition more expensive, but they don't all raise the platform's price directly:
- Auction competition increases the pressure on bids when advertisers pursue the same inventory.
- Promotion calendars change demand for placements and the offers buyers expect.
- Creative fatigue can reduce response when people repeatedly encounter the same message.
- Low order value limits what you can afford to pay, even if the auction price doesn't change.
- Weak landing pages lose visitors after you've paid to attract them.
- Audience overlap can fragment your testing and complicate performance comparisons.
- Policy or tracking changes can affect delivery, measurement, and the decisions you make from reported results.
That distinction matters. If customers buy too little to cover acquisition, cheaper bidding alone may not repair the business model.
Improve relevance before raising bids
Google's explanation of ad quality says higher-quality ads can achieve better positions and typically lower actual CPC, while low-quality ads may pay close to their maximum CPC even with limited keyword competition. Google evaluates signals including expected click-through rate, ad relevance, and landing-page experience.
Keep the promise consistent. The audience, headline, offer, evidence, and product claim on the destination should match the originating ad. Don't advertise an explanation of a customer's problem and then send them to a page that immediately demands a purchase without answering it.
Quality Score is a diagnostic tool, not the auction-time calculation itself. Track the journey through landing-page views, engaged visits, cart additions, and purchases rather than treating the score as a profit measure.
For a longer-term channel comparison, consider how SEO investment for competitive DTC brands differs from buying immediate traffic. Organic acquisition still requires spending, but its production and maintenance commitments have a different shape.
Calculating CAC, LTV and Break-Even Cost
Calculate acquisition economics from your financial records and customer cohorts, not just an advertising dashboard. Use a spreadsheet with separate inputs for spending, new customers, order profit, and repeat purchases.
Build the calculation in order
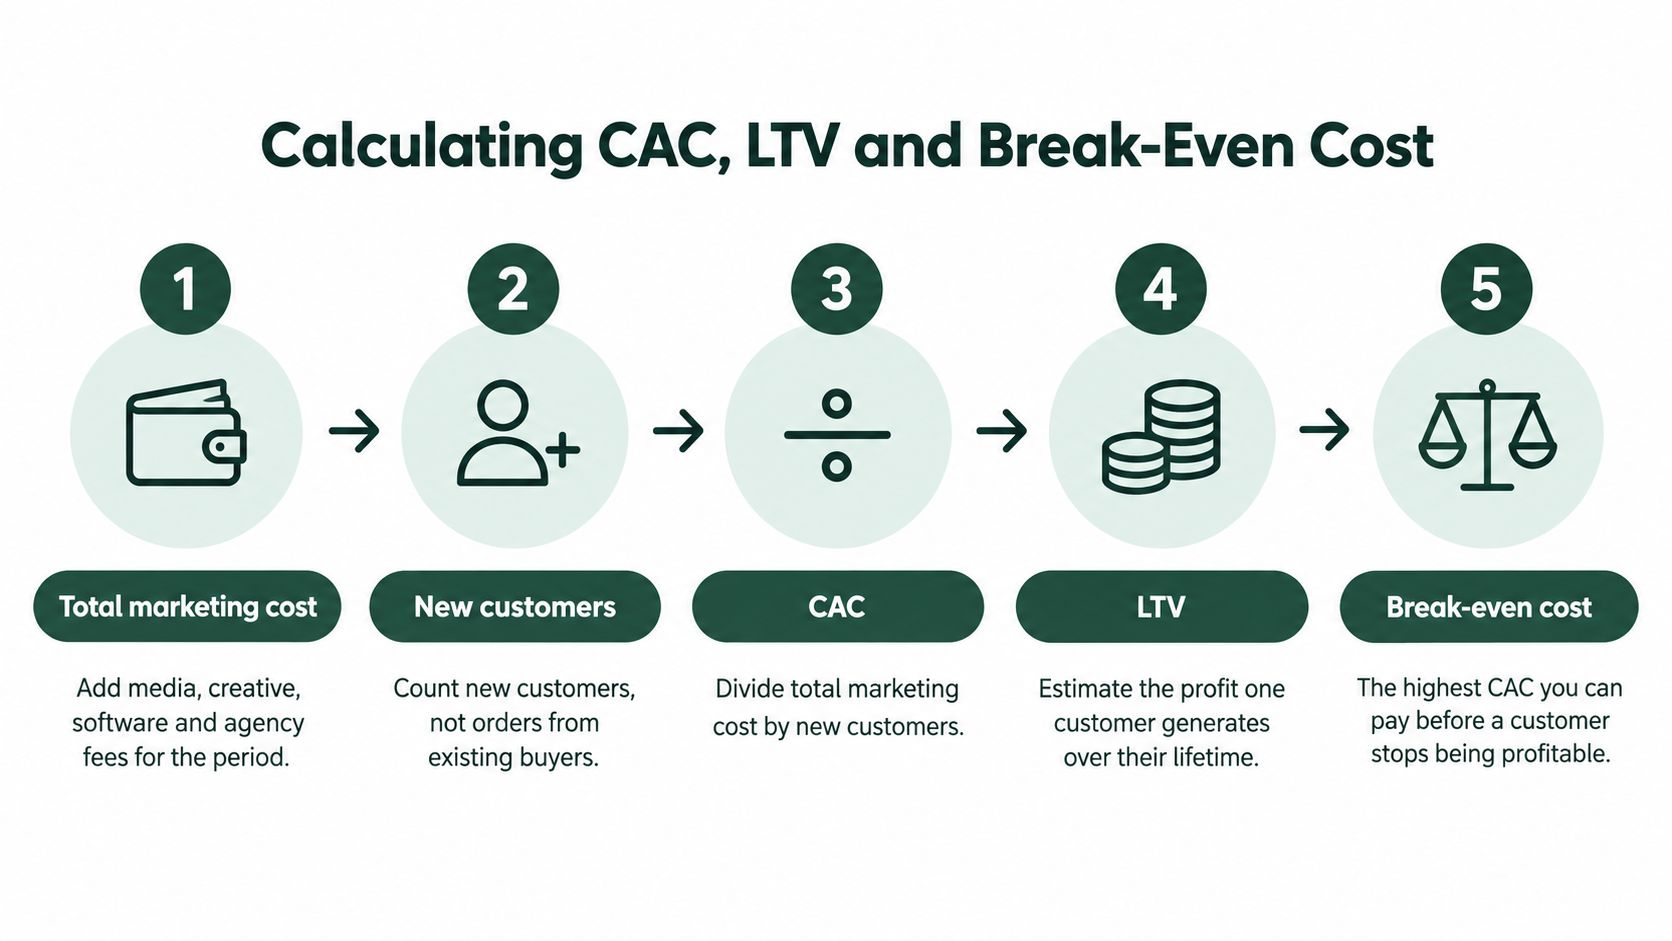
- Pull total marketing cost. Include media, creative, software, and agency fees for the chosen period. Allocate shared costs consistently.
- Count new customers. Exclude repeat orders from existing buyers when calculating acquisition cost.
- Calculate customer acquisition cost. Divide acquisition-related marketing cost by new customers acquired.
- Find gross profit per order. Multiply average order value by gross margin, using revenue after discounts and returns.
- Estimate repeat purchasing. Use observed customer cohorts over a defined period. Don't substitute an optimistic retention target for purchase history.
- Set allowable CAC. Start with first-order profit, then include only the future profit you're prepared to finance.
- Compare actual and allowable CAC. A campaign can generate sales while still exceeding your affordable acquisition ceiling.
The process below connects spending to customer value.
Keep revenue LTV separate from profit LTV
Customer lifetime value, or LTV, needs a label. Revenue LTV measures sales; gross-profit LTV deducts product costs; contribution LTV also deducts relevant variable costs such as payment processing, fulfillment, and returns.
For a conservative acquisition ceiling, contribution is more useful than revenue. Gross profit is a starting point, not permission to spend every remaining dollar on advertising.
Use this symbolic worked example so each relationship is visible:
| Calculation | Arithmetic |
|---|---|
| Gross profit per order | Average order value × gross margin |
| Gross-profit value over the chosen period | Gross profit per order × expected orders per customer |
| Later-order profit | Period gross-profit value − first-order gross profit |
| Allowable CAC | First-order contribution + approved share of later contribution |
| Orders needed to recover CAC | CAC ÷ contribution per order |
Say a refillable skincare brand earns enough contribution on the initial purchase to cover only part of acquisition. Repeat refills might repay the rest, but only if buyers actually reorder and the business can finance the wait.
Compare the required order count with the cohort's expected purchasing. If recovery requires more orders than customers normally place, the campaign doesn't become viable merely because its revenue return looks attractive.
Future customer profit isn't cash you have today. Set the share you're willing to fund according to evidence and cash reserves.
For another practical explanation of acquisition inputs, use Alpha Omega Digital on reducing CAC. Keep the accounting definitions consistent when you compare ROI across marketing channels.
Finally, distinguish attributed customers from incremental customers. Dividing media and production cost by incremental customers estimates acquisition spending per buyer the activity actually added; it doesn't itself measure contribution margin. Assess profitability by placing that cost beside the contribution those buyers generate.
How Much Your Brand Can Afford to Spend
Spend approach by brand stage
| Stage | Typical profile | Spend rule | Where the budget goes |
|---|---|---|---|
| Cash-constrained brand | Thin margin, few repeat buyers, limited cash | Keep CAC within first-order contribution | A proven offer, tightly controlled acquisition, economical creative |
| Profitable growth brand | Healthy margin and demonstrated repeat purchasing | Include a conservative portion of later contribution | Paid testing, pre-sell pages, retargeting, and creative |
| High-repeat-purchase brand | Replenishable products or subscriptions with observed retention | Require repayment within a cash-supported window | Retention activity alongside steady acquisition |
Your affordable budget begins with cash and customer contribution, not the spending habits of another company. A business can have attractive long-term customer value and still run short of money while waiting for repeat purchases.
For a cash-constrained brand, first-order recovery protects the ability to replenish stock and fulfill orders. Concentrate on an offer with evidence behind it rather than spreading a small budget across unrelated products and audiences.
Give future profit a financing limit
A profitable growth brand has more room to experiment, but should still reserve money for production, measurement, and customer communication. Buying traffic without funding the assets that support it can leave the team unable to fix a weak campaign.
For a high-repeat business, inspect retention by acquisition cohort and source. Subscription signup isn't the same as retained subscription revenue, and a discount-led cohort may behave differently from customers acquired through product education.
A practical allocation process is to fund commitments in this order:
- Protect operations: Reserve cash for inventory, fulfillment, refunds, and existing obligations.
- Fund reliable activity: Maintain acquisition that meets your contribution and payback requirements.
- Reserve production capacity: Budget for new messages, page improvements, and measurement.
- Release test funding deliberately: Define the question a test must answer before spending.
Judge the customer, not just the acquisition price
A higher-cost campaign can be rational if its buyers keep products, reorder without heavy discounting, or repay acquisition sooner. Conversely, an inexpensive campaign can disappoint if it attracts refund-prone customers.
Don't assume those differences. Compare cohorts using the same observation window and include retention costs in the calculation.
Cheap acquisition isn't the objective. Affordable acquisition of customers who contribute profit is.
Your spending ceiling should change when margins, inventory, or repeat-purchase behavior change. Treat the budget as a controlled commitment, not an entitlement attached to revenue.
In-House Team or Agency Costs Compared
The same production budget can be cheap for one brand and ruinous for another. A retainer divided across a steady stream of pages adds a small toll to each customer acquired; the same retainer covering occasional work makes every delivered page expensive. Judge each buying model by cost per approved, published asset, not by the headline fee.
In-house, freelance, agency and self-serve costs compared
| Option | Upfront cost | Ongoing cost | Speed to first page | Best fit |
|---|---|---|---|---|
| In-house marketer | Recruiting, onboarding, and tools | Salary, benefits, and software | After hiring and onboarding | Continuous work requiring brand knowledge |
| Freelance copywriter or designer | Briefing and project setup | Project or asset fees | According to scope and availability | Specialist work and overflow |
| Full-service agency retainer | Discovery and onboarding | Recurring retainer | After strategy and production setup | Coordinated channel management |
| Agency-built advertorial | Agreed page-production fee | Additional pages, revisions, or maintenance | According to the production schedule | Bespoke, high-stakes work |
| Self-serve pre-sell page platform | Setup and subscription selection | Subscription and internal editing time | Draft generation followed by review | Frequent variants and small production teams |
An in-house marketer creates a fixed commitment. The actual monthly figure is salary plus design support, tools, and management time, so the model suits teams with steady work where brand knowledge compounds week over week.
Freelancers let you purchase defined outputs instead of capacity. An agency retainer buys broader coordination across channels, although you should confirm whether landing-page production, tracking implementation, and creative revisions sit inside the retainer or get billed separately.
Compare the delivered asset, not the headline fee
Request quotes against the same brief. Specify the page structure, mobile layout, analytics requirements, publishing destination, revision allowance, and ownership of source files so each proposal prices the same deliverable.
Hidden costs often appear in:
- Revision rounds: Extra feedback cycles beyond the agreed scope.
- Internal review: Staff time spent briefing, checking claims, and approving design.
- Production delays: Paid campaigns waiting for an approved destination.
- Maintenance: Updating offers, evidence, links, and product details after launch.
When shortlisting agencies, ask each firm what it delivers and how it measures results rather than treating a ranking as proof of fit. Rankings also exist for adjacent specialties, and AY Rank compares the best GEO agencies, firms focused on visibility inside generative search engines rather than advertorial or landing-page production. A firm strong in one discipline may not cover the other, so build the shortlist around the work you actually need done.
Match the buying model to the workload
Among self-serve options, Landra generates editable advertorial and listicle drafts from product URLs, with publishing options including Shopify, Webflow, and HTML export. Compare that workflow with a general page builder, which leaves more manual layout work to your team, or a specialist freelancer producing a bespoke asset.
Generated copy still needs a brand check and a compliance review. Someone must verify product claims, testimonials, comparisons, and offer terms before publication.
Buy a defined project when the work is occasional and specialized. Buy capacity when the workload is continuous. Include internal editing and approval time in either comparison, because that staff time is part of the toll each page adds to your acquisition cost.
How to Lower Your Marketing Price Without Cutting Reach
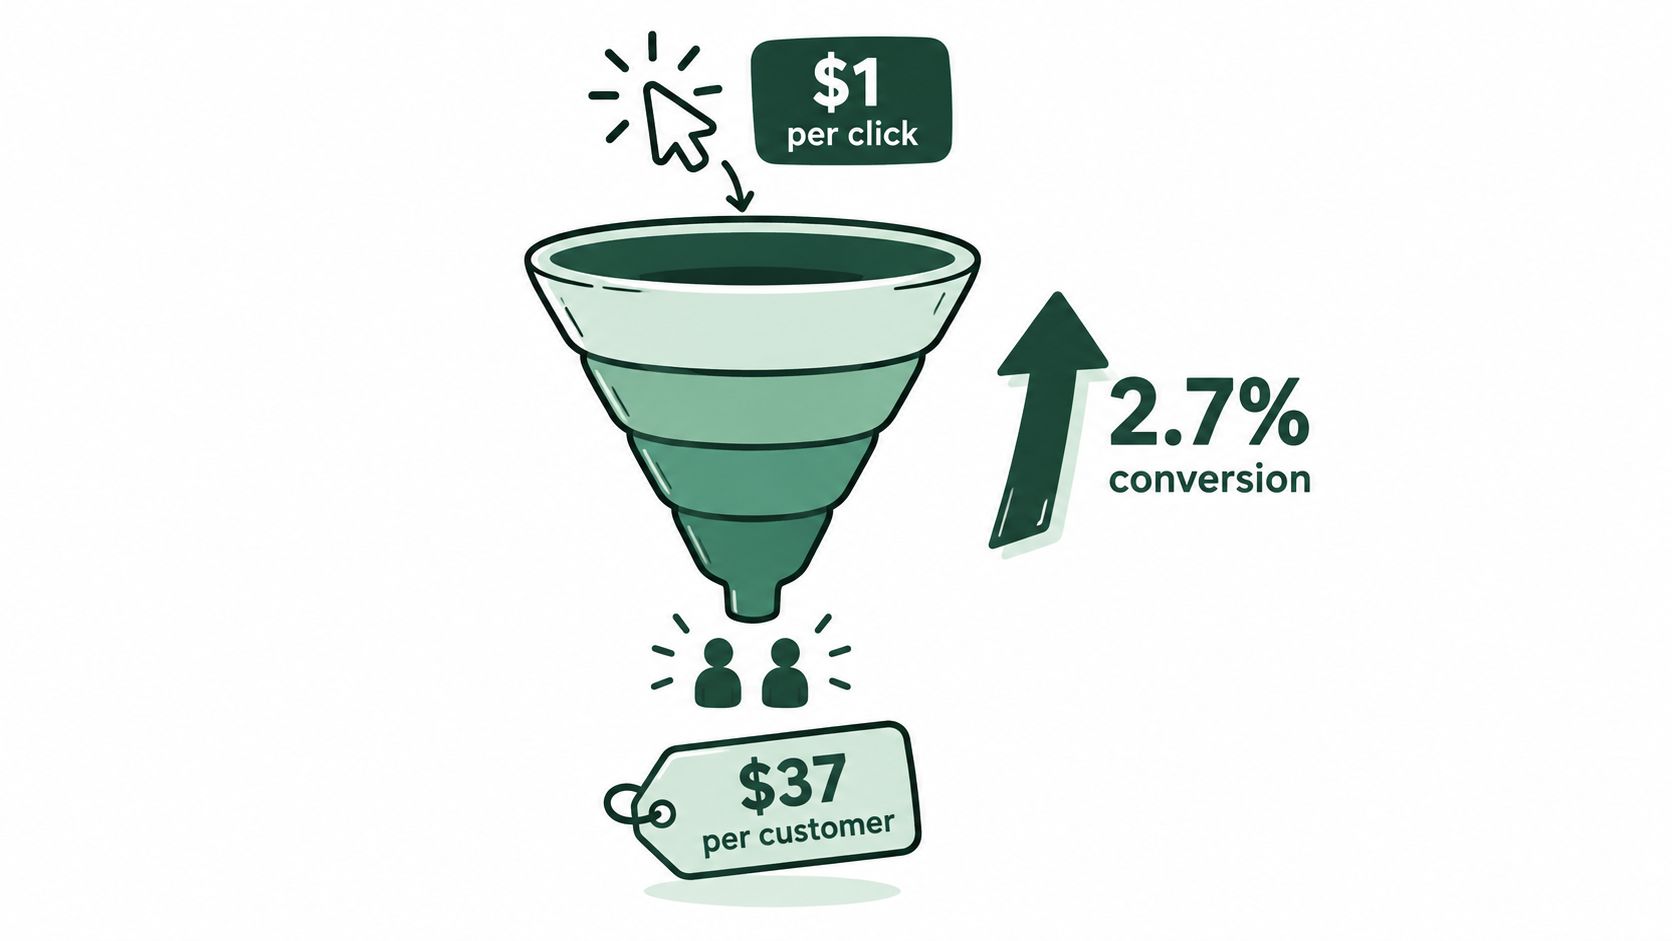
At a hypothetical $1 per click, a funnel converting 2% of clicks produces a $50 media CAC; a 35% relative conversion improvement, to 2.7%, lowers it to approximately $37.04, a 25.9% reduction with traffic quality and CPC unchanged. This arithmetic illustrates the opportunity identified by Baymard's ecommerce usability research, which reports that the average ecommerce site could improve conversion by 35% through checkout-design improvements.
That isn't a forecast for your store or evidence that adding a pre-sell page will produce the same gain. It shows why improving the path after the click can matter as much as negotiating a cheaper click.
The funnel illustration separates click price from customer cost.
Test the landing path without changing the experiment
Use a controlled comparison to find out whether customers need more explanation before the product page.
- Choose a focused audience and ad angle. Keep the customer problem and creative consistent.
- Create competing paths. Compare an educational pre-sell destination with direct-to-product traffic.
- Randomize assignment. Keep the offer, placements, bidding approach, and audience conditions comparable.
- Set the stopping rule in advance. Choose the minimum sample and conversion requirements using your baseline performance and the improvement worth detecting.
- Compare customer economics. Report conversion change, absolute CAC change, contribution after acquisition, and production cost.
Don't stop the experiment because an early result looks exciting. Check tracking before launch, allow for purchase delays, and avoid changing checkout during a landing-page test.
For a broader measurement checklist, a CAC framework for e-commerce growth teams from AdCrafty can help organize the acquisition inputs. Use Landra's DTC acquisition cost playbook alongside your account and store records, not as a substitute for them.
Match page length to the purchase decision
| Illustrative case | Why the path might fit | What to judge |
|---|---|---|
| Skincare device advertised to cold social traffic | Buyers may need an explanation of the mechanism, suitability, evidence, and limitations | Contribution after acquisition and customer quality |
| Familiar accessory with a straightforward offer | Another page may delay shoppers who already understand the item | Completed purchases without unnecessary friction |
For the device, carry the ad's problem framing into a clear explanation before asking for the sale. For the accessory, test whether direct product access serves shoppers better.
This video offers additional context for evaluating a pre-sell workflow.
Keep checkout improvements separate from page-angle experiments. On mobile, inspect form entry, visibility of order details, and the ease of correcting mistakes.
Finally, record production time per variant. A page that improves conversion can still be an expensive choice if creating and maintaining it consumes too much staff or contractor time.
Set Your Allowable CAC Before the Next Campaign
Place your current acquisition cost beside the contribution-based ceiling your business can finance. Then make a decision before approving more traffic.
- Below the ceiling: Expand cautiously while checking whether payback and customer quality remain acceptable.
- Above the ceiling with a plausible repair: Hold expansion and test the offer, message, or destination.
- Far beyond a credible recovery path: Pause the activity and reconsider the audience or acquisition angle.
Assign ownership before spending
Name the person responsible for the calculation, the accounting inputs, and the next review date. Give them access to advertising costs, production invoices, and customer cohort results.
For a considered purchase, make the next experiment a pre-sell versus product-page comparison. Use a Conversion Rate Calculator to model the required improvement and a Headline Analyzer to review the opening claim, then check the Advertorial Compliance Checklist before publishing.
The price of marketing is a relationship between spending and customer contribution, not a budget decision made once and forgotten. Your next action is to write down an allowable CAC and approve only a test that can help you reach it.
Build an editable pre-sell page from a product URL, review its claims, and test it against your current product-page path. Visit Landra to explore advertorial and listicle generation, then judge the result by customer contribution, acquisition cost, and the time your team spends producing it.