

The most popular advice about marketing ROI is also the easiest to misuse: subtract marketing spend from revenue, divide by spend, and call the result profitability. That calculation can tell you something useful, but it doesn't tell you whether the campaign paid for the products, delivery, returns, and acquisition work behind those sales. A useful marketing ROI calculation starts with a less flattering question: what profit did this activity create?
Table of Contents
- Why Most Marketing ROI Numbers Are Wrong
- The Core ROI Formulas You Actually Need
- Channel-Level and Campaign-Level Examples
- Attribution vs Incrementality
- Adjusting for LTV and Gross Margin
- Common Pitfalls That Quietly Inflate ROI
- Ready-to-Use Templates and Calculators
Why Most Marketing ROI Numbers Are Wrong
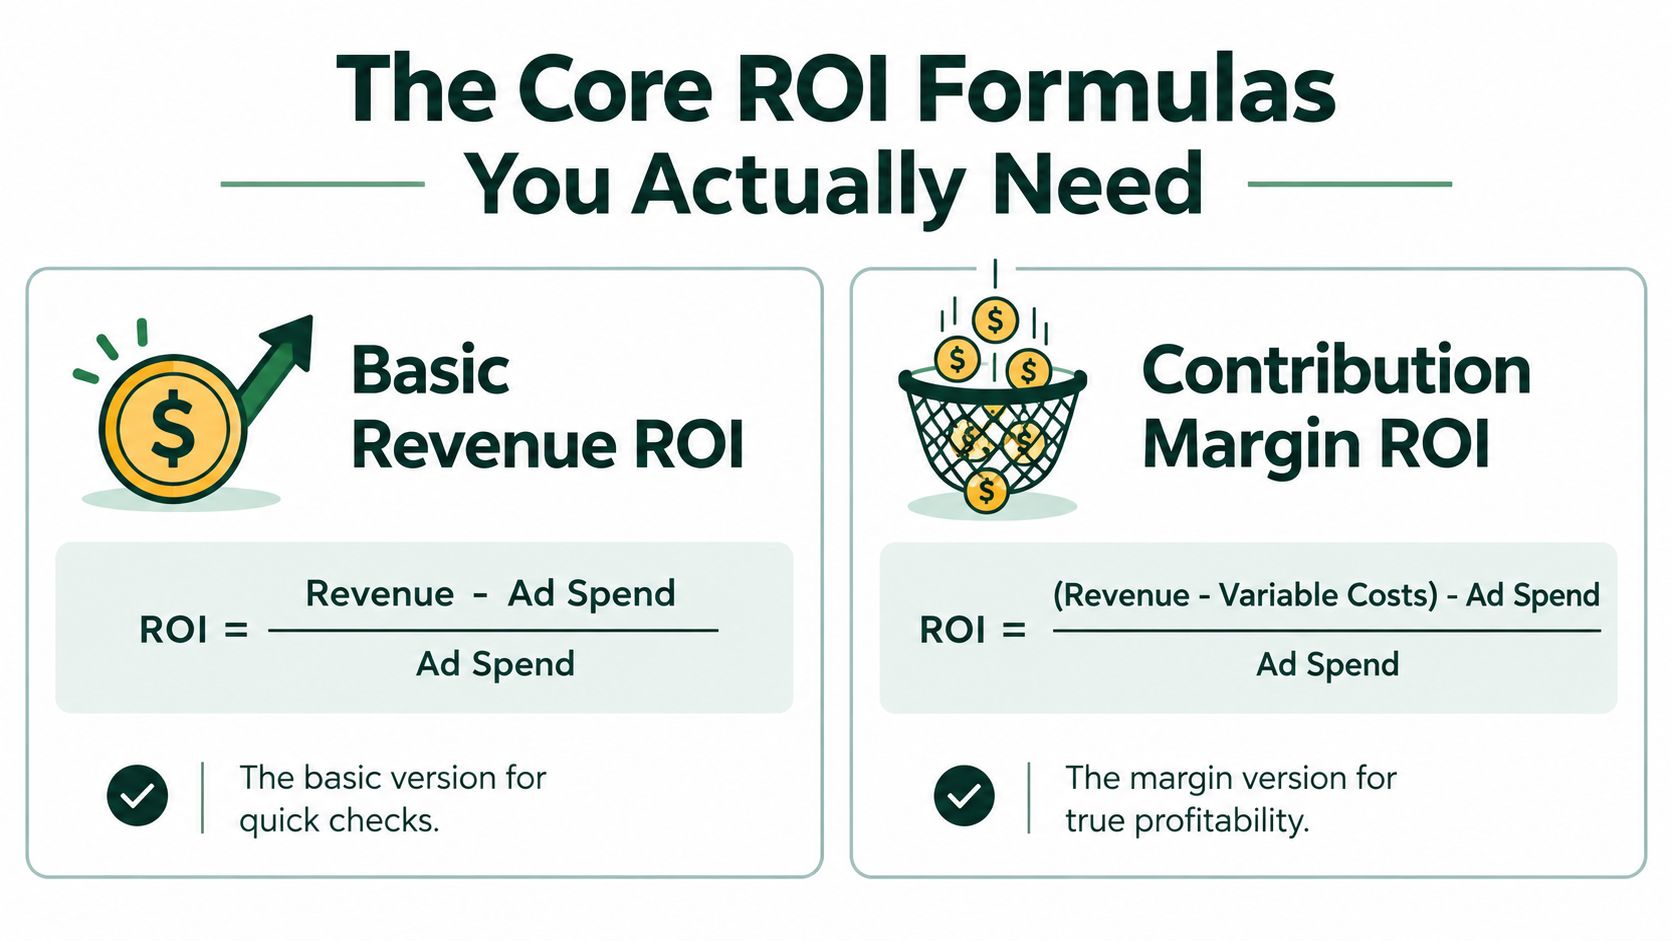
Marketers can mean different things when they say ROI. Revenue-based ROI subtracts marketing cost from revenue. Contribution-margin ROI deducts the variable costs of serving those orders before subtracting marketing cost.
Those definitions aren't interchangeable. If a growth lead presents the revenue version while finance expects the contribution version, they aren't disagreeing about performance. They're evaluating different things.
For operating decisions, use contribution-margin ROI as the default. Keep revenue-based ROI visible as a diagnostic, clearly labeled, rather than letting it stand in for profit.
Decide what the calculation must answer
A defensible calculation needs a written scope before anyone opens Meta Ads Manager:
- Decision: Are you evaluating another allocation of campaign budget, the economics of an entire channel, or the marketing function?
- Cost boundary: Which expenses belong to that decision, including work billed outside the advertising account?
- Revenue boundary: Which orders, customer groups, and sales periods qualify?
- Evidence standard: Is the revenue attributed to marketing, or have you estimated how much marketing caused?
The distinction between attributed and incremental revenue matters enough to keep separate columns for them. A spreadsheet shouldn't upgrade a tracking result into a causal conclusion.
Practical rule: Put the ROI definition beside the result, not in a footnote nobody reads.
Don't confuse contribution profit with company-wide net profit, either. A campaign can contribute positively toward rent, salaries, and other fixed expenses without covering the entire business's overhead. Conversely, loading every fixed expense onto a small experimental campaign can make a useful marginal investment look unattractive.
The sensible answer is to maintain decision-level economics and fully loaded marketing economics separately. Use the former to assess an additional investment and the latter to judge whether the broader program supports the business. Don't change definitions midway through a budget review because another version looks better.
The Core ROI Formulas You Actually Need
Keep the revenue calculation and the contribution calculation side by side. The comparison makes the cost boundary visible before anyone starts discussing scale.
Calculate return on the same cost base
Use these expressions, formatted as percentages in your spreadsheet:
| Metric | Formula | Appropriate use |
|---|---|---|
| Revenue-based ROI | (Incremental revenue − marketing cost) ÷ marketing cost | A quick revenue-efficiency check |
| Contribution-margin ROI | (Incremental revenue × contribution margin − marketing cost) ÷ marketing cost | A profitability assessment before fixed overhead |
A campaign generating $150,000 in incremental revenue from $50,000 of marketing expenditure produces 200% revenue-based ROI; at a 60% contribution margin, it generates $90,000 in contribution profit, leaving $40,000 after marketing cost and 80% contribution-based ROI, using the marketing return-on-investment calculation.
The denominator remains marketing cost. Incremental contribution profit after marketing belongs in the numerator, not the denominator.
Also distinguish ROI from return on ad spend, or ROAS. Revenue divided by advertising spend doesn't deduct that spend, and it doesn't establish profitability. Label the metric correctly rather than expecting a finance reviewer to infer your formula.
Match the margin to the orders
Use a contribution margin that reflects the actual order mix. If you already deducted fulfillment and payment processing when calculating that margin, don't subtract them again elsewhere.
For additional formula practice, Netco Design LLC's real-world ROI examples provide a supplementary reference. Apply your own cost definitions rather than assuming another calculator uses the same boundaries.
For a video supplement to the spreadsheet work:
If your reporting also includes inquiries or intermediate conversions, keep those upstream indicators separate from realized returns. The dashboard setup for lead gen is a useful companion for structuring that distinction.
A correct formula can't rescue mismatched inputs. Revenue, margin, and marketing cost must describe the same activity and measurement period.
Channel-Level and Campaign-Level Examples
Consider a hypothetical skincare device sold through Shopify. A customer sees a Meta ad, visits a pre-sell page, and completes checkout on the product page. Keep that product and journey consistent while changing the reporting scope.
At the ad-set level, evaluate the spend and production work associated with that audience and creative combination. If the creative also runs elsewhere, apply a documented allocation rule rather than charging its full production cost to every ad set.
The result is useful for optimization, but it isn't automatically causal evidence. Unless the experiment supports an ad-set-level lift estimate, label the return as attributed contribution rather than incremental contribution.
Follow the product through the reporting hierarchy
At the campaign level, combine the underlying spend, revenue, and contribution amounts before calculating ROI. Don't average the ad sets' ROI percentages. Their investment sizes can differ, so an unweighted average can misrepresent the campaign.
A profitable campaign can contain an unprofitable ad set. That doesn't automatically justify switching the ad set off: it might serve a different acquisition role or have less mature revenue. It does justify investigating the difference.
At the paid-social level, combine Meta and TikTok costs with shared creative, management, and measurement expenses. Deduplicate orders before assigning a return to the combined channel. Adding each platform's claimed revenue isn't a substitute for reconciling purchases.
At the blended level, include the marketing mix rather than just paid social. Branded search, email production, software, and other marketing work belong within the agreed scope. If blended economics look worse than channel reports, investigate overlapping credit and omitted costs before concluding that another channel destroyed value.
Marketing ROI at Four Levels
| Level | Example Cost Inputs | Return Basis | Why It Differs |
|---|---|---|---|
| Ad set | Media spend, allocated creative production | Contribution associated with the tested activity, with evidence labeled | Narrow enough for tactical decisions |
| Campaign | All included ad sets, campaign-specific production and management | Combined contribution before campaign marketing cost | Reveals the net effect of its components |
| Paid social | Meta and TikTok spend, shared agency fees, measurement tools | Deduplicated contribution across paid social | Includes channel-wide operating expenses |
| Blended marketing | Paid media, email, branded search, shared tools and team costs | Business-level incremental contribution where estimable | Tests the economics of the overall investment |
When reviewing reporting options, use the Excellorix marketing analytics dashboard as a reference point for your dashboard requirements. Specify the definitions and reconciliation checks before choosing how to display them.
Aggregation changes the question, not just the size of the number. Ad-set reporting supports execution; blended reporting supports the budget. Neither replaces the other.
Attribution vs Incrementality
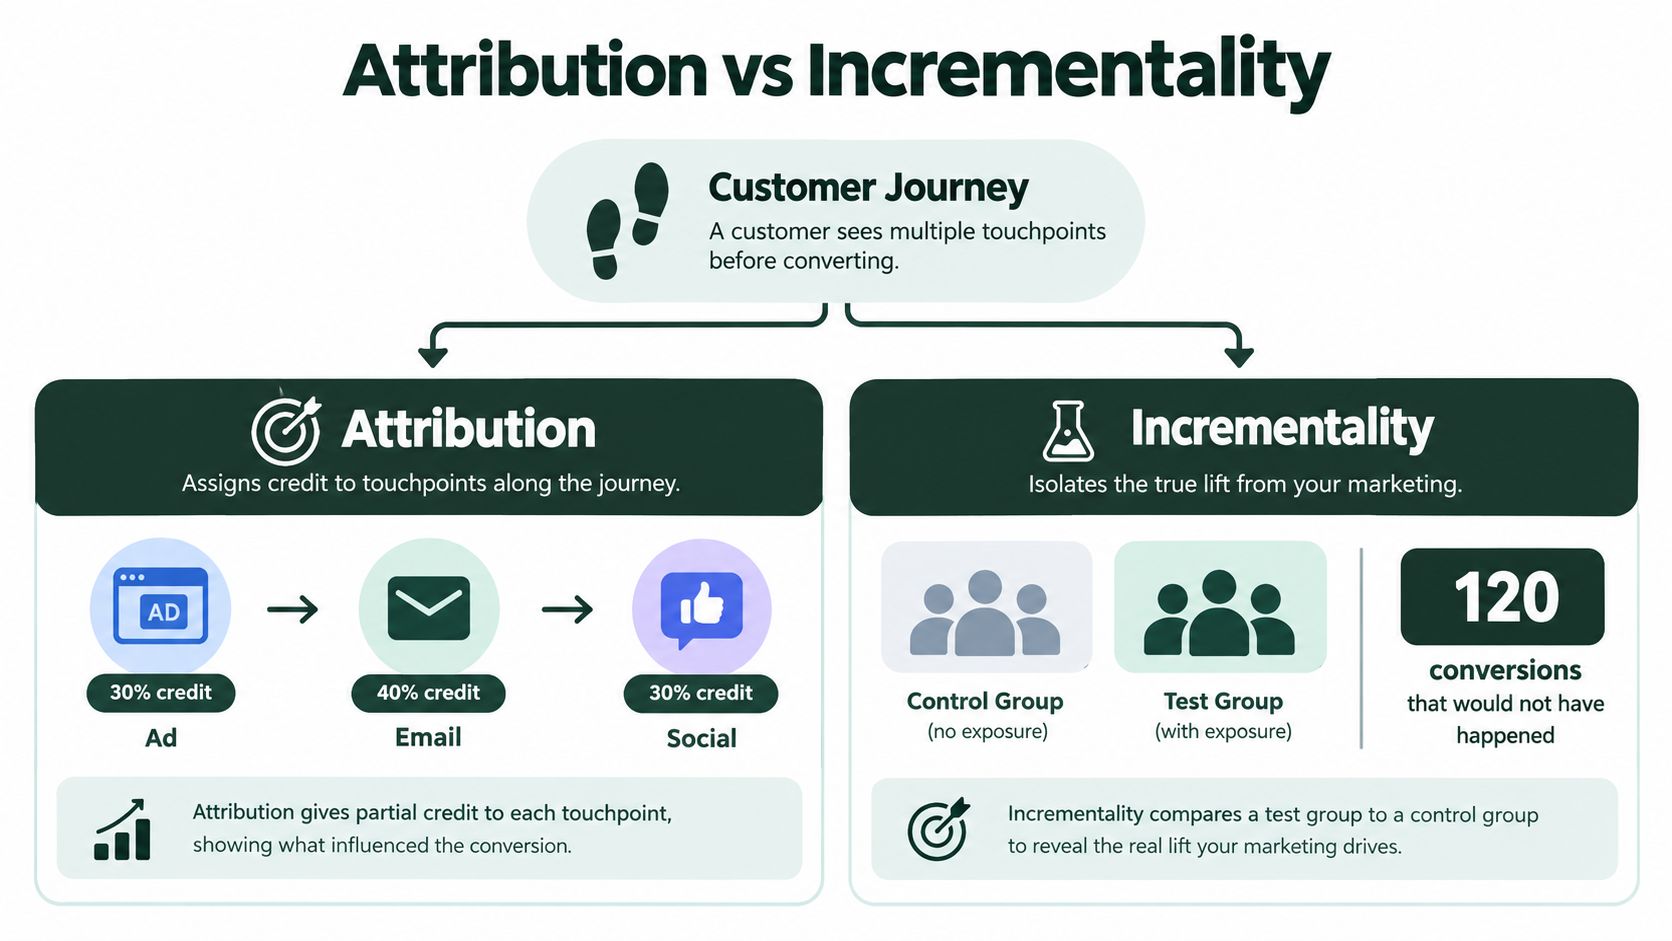
Attribution assigns credit. Incrementality estimates additional sales. A customer can have a traceable advertising touchpoint without needing that advertising to make the purchase.
That distinction is the central reason not to treat a Meta, TikTok, or analytics revenue report as a profit experiment. Tracking a conversion and causing it are different claims.
The measurement approaches separate at the question they're designed to answer:
Choose evidence that fits the decision
| Method | Question it answers | Limitation to account for |
|---|---|---|
| Meta or TikTok reporting | Which conversions receive credit under the platform's rules? | Credited buyers may already have intended to purchase |
| Google Analytics attribution | How is credit distributed across observed touchpoints? | Credit allocation doesn't establish a no-marketing counterfactual |
| Audience holdout | What changes when a comparable group doesn't receive the intervention? | Contamination, sampling uncertainty, and implementation quality |
| Geographic holdout | How do treated and comparison markets differ? | Market comparability and unrelated regional changes |
Don't assume that a more elaborate attribution model solves causality. It can redistribute credit without establishing whether the purchase would've happened anyway.
NotFair's Google Ads ROAS tracking examples are a useful supplementary resource when considering cross-platform reporting. Use that reporting for reconciliation, not as a replacement for a holdout.
Run a holdout without overselling the result
Define the eligible audience, intervention, outcome, and measurement window before launch. Withhold the activity from a comparable control group, then assess the difference in contribution outcomes.
For a geographic design, document why the comparison markets are credible controls. Avoid changing promotions, availability, or other major conditions differently across groups if you want an interpretable result.
The practical cost includes setup work and the opportunity cost of withholding activity. Small samples, infrequent purchases, and variable order values can leave substantial uncertainty even when the design is sensible, which is why incrementality measurement requires treatment-and-control reasoning.
Report the estimated return alongside its uncertainty. An inconclusive experiment isn't evidence of no effect.
Keep execution diagnostics alongside that analysis. Landra's DTC ad metrics guide can support the operational review without turning click or conversion metrics into causal profit estimates.
For a landing-page comparison, randomizing the destination tests the routing decision. It doesn't, by itself, establish the incrementality of the advertising that brought visitors there.
Adjusting for LTV and Gross Margin
A first-order calculation asks whether the initial purchase covered acquisition. An LTV-adjusted calculation asks whether the acquired customer generates enough contribution over a defined horizon. Neither should replace the other.
The useful adjustment isn't multiplying CAC by LTV. Compare customer contribution value with acquisition cost, using compatible cohorts and time periods.
A whiteboard model can help expose those assumptions before they become spreadsheet defaults:

Build contribution LTV before adjusting ROI
Start with a cohort of newly acquired customers. Calculate net purchase revenue over a stated horizon, then deduct product and variable servicing costs across those purchases.
Subtract retention marketing costs separately unless they are already included in your customer contribution measure. A repeat order does not become free because the customer was acquired earlier.
Use this relationship:
LTV-adjusted ROI = (Customer contribution over the horizon − acquisition cost) ÷ acquisition cost
At the per-customer level, use contribution LTV and CAC. At the cohort level, use total contribution and total acquisition cost. Don't mix a cohort's revenue with an individual customer's CAC.
- Observed contribution: Calculate it from completed purchases and actual costs.
- Forecast contribution: Identify it explicitly as an estimate, with retention and margin assumptions.
- Blended LTV: Weight customer segments by the acquired cohort's mix rather than averaging segment values equally.
- Payback: Track when cumulative contribution covers acquisition and retention spending.
Compare products without inventing repeat behavior
Consider a hypothetical durable device and a replenishment product with the same acquisition spend and customer count. The device might generate stronger initial contribution, while the replenishment product could produce more contribution later if customers reorder.
That later advantage is conditional. Without observed repeat purchases or a defensible forecast, replenishment is a product characteristic, not proof of profitable retention.
Cash check: A positive forecast doesn't fund today's inventory purchase. Keep payback timing visible beside LTV-adjusted ROI.
When testing the approach described in Landra's presell page strategy, follow the acquired customer cohort beyond checkout. A destination that attracts different buyers may change repeat behavior and margin mix as well as initial conversion.
Don't apply the store's historical blended LTV automatically to every new channel. Compare like-for-like cohorts, and show first-order, observed-to-date, and forecast outcomes separately.
Common Pitfalls That Quietly Inflate ROI
A spreadsheet can calculate perfectly and still mislead because somebody chose the wrong inputs. Audit the definitions before debugging the arithmetic.
These are the checks to keep beside the monthly report:
Audit revenue before accepting the result
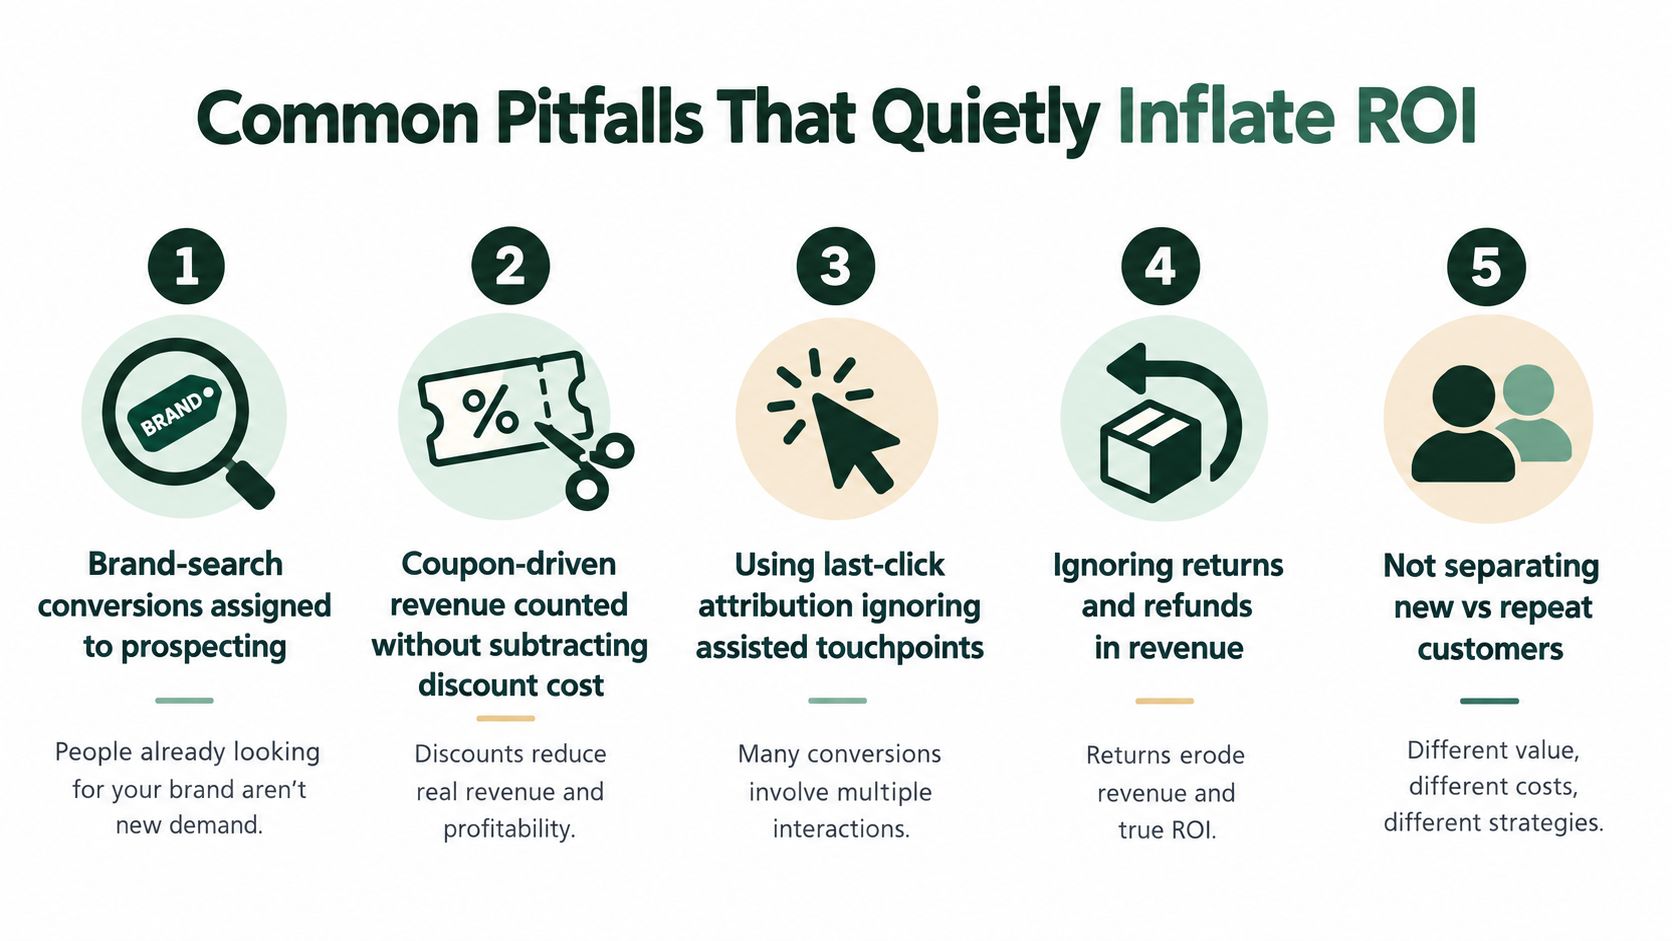
- Brand-search credit: Don't assign all branded-search purchases to prospecting because prospecting ran earlier. Keep the attribution rule explicit and test the causal claim separately.
- Discount treatment: Use revenue after discounts. If your Shopify export already reports discounted sales, don't deduct the same coupon again.
- Refund maturity: Flag revenue from orders whose return behavior hasn't matured. Update the cohort instead of permanently preserving the launch-week result.
- New versus repeat buyers: Separate acquisition outcomes from existing-customer purchases. Total order count isn't a defensible denominator for new-customer CAC.
- Non-DTC orders: Exclude samples, test purchases, and wholesale transactions from direct-response customer revenue unless the analysis explicitly covers them.
Reconcile costs with the ledger
Payment processing, fulfillment, and variable customer-service expenses need a defined home in the contribution calculation. Creative production, agency retainers, and measurement subscriptions need a defined home in marketing cost.
The fix isn't to subtract everything everywhere. Assign each expense once, document the allocation, and reconcile the total with finance.
- Outside-the-account invoices: Review accounts payable, not just advertising exports.
- Shared production: Allocate reusable creative consistently rather than charging or omitting it opportunistically.
- Forecast substitution: Don't replace weak observed contribution with optimistic LTV while leaving the result labeled as realized ROI.
- Customer-value mismatch: Don't use revenue LTV against contribution-based acquisition targets.
Not every measurement error inflates ROI. Using first-order value alone can undervalue a profitable repeat-purchase business, while an unsupported lifetime forecast can exaggerate it. The objective is a comparable result, not the highest result.
Ready-to-Use Templates and Calculators
Build the workbook around inputs, calculations, and evidence quality. Keep imported values separate from assumptions so a reviewer can identify which changes alter the result.
Channel-level spreadsheet layout
Copy these fields into your reporting sheet:
| Field | Entry or calculation | Review flag |
|---|---|---|
| Channel and cohort | Channel name, acquisition period, outcome horizon | Inconsistent periods |
| Marketing costs | Ad spend, platform fees, creative, agency, allocated tools | Missing or duplicated invoices |
| Attributed revenue | Revenue credited under the named model | Not causal evidence |
| Incremental revenue | Estimated additional net revenue | Missing experiment or model |
| Contribution margin | Margin after defined variable costs | Store average applied to a different mix |
| Incremental contribution | Incremental revenue × contribution margin | Uncertain incrementality |
| Incremental profit | Incremental contribution − marketing cost | Incomplete cost boundary |
| Contribution ROI | Incremental profit ÷ marketing cost | Unsupported precision |
| CAC | Acquisition cost ÷ new customers | Repeat buyers included |
| Contribution LTV:CAC | Contribution LTV ÷ CAC | Forecast presented as observed |
Trust reconciled transactions and invoices for what they record. Flag modeled lift, immature returns, and future retention as estimates, even when they appear in polished dashboard cells.
Single-campaign calculator
Create input cells for marketing spend, net revenue, gross margin, variable fulfillment and processing costs, incremental revenue, and cohort contribution LTV. If gross margin excludes fulfillment, subtract fulfillment separately; if your contribution margin already includes it, don't.
Set up outputs for:
- Revenue ROI: Net revenue less marketing cost, divided by marketing cost, labeled attributed or incremental.
- Contribution ROI: Contribution before marketing less marketing cost, divided by marketing cost.
- LTV-adjusted ROI: Cohort contribution over the stated horizon less acquisition cost, divided by acquisition cost.
For a pre-sell-page versus product-page test, keep audience eligibility and offer conditions comparable. Include page-production costs, follow order quality, and evaluate contribution per eligible visitor alongside CAC.
At the monthly review, confirm the cost scope, reconcile revenue, inspect cohort maturity, review uncertainty, and record the next budget decision. The workbook should support a decision, not merely produce a percentage.
Landra generates editable advertorial and listicle pre-sell pages from product URLs for DTC brands. Visit Landra to create a test destination alongside your product page, then use this workbook to compare contribution profit, acquisition cost, and payback rather than conversion rate alone.