
You've increased paid social spend, the lead form is filling up, and the dashboard looks healthy at first glance. Then sales reports that conversations are weak, qualified opportunities are scarce, and revenue hasn't moved with the lead count. That situation is common because lead volume measures activity, not business value.
Lead generation key performance indicators work best as a diagnostic chain. They show whether the right people are arriving, whether your page earns a response, whether those responses meet your qualification standard, and whether sales converts qualified demand into customers. A DTC growth team needs this full view, especially when cold traffic comes from Meta or TikTok and the first page a visitor sees can shape both conversion and lead quality.
The practical shift is simple: stop asking only, “How cheaply can we generate a lead?” Ask, “Which traffic, page, and follow-up combination produces valuable customers at an acceptable cost?” A useful starting point is this 2026 lead generation guide, but the work begins when you connect each metric to the next stage of the funnel.
Table of Contents
- Why Lead Generation KPIs Decide Revenue Not Just Leads
- How the Lead Generation Funnel Really Works
- Core Lead Generation KPIs and How to Calculate Them
- Segmenting KPIs by Channel and Landing Page Type
- Benchmarks and Diagnostics That Reveal Funnel Health
- Tracking Setup and Dashboard Design for Reliable KPIs
- Turning KPI Insights Into Higher Converting Funnels
Why Lead Generation KPIs Decide Revenue Not Just Leads
A campaign can generate more leads while producing less revenue. For example, a broad social audience may submit a quiz because the offer is entertaining or easy to access, while showing little interest in buying. The acquisition report celebrates the low CPL, but the sales team sees a queue of contacts who don't match the product, timing, or buying intent.
That's why lead generation KPIs should behave like warning lights on a car dashboard. Lead count tells you whether fuel is entering the system. Visitor-to-lead rate shows whether the page turns attention into action. MQL-to-SQL rate tests whether marketing is attracting and identifying serious prospects. Lead-to-customer rate tells you whether the whole machine produces revenue.
Practical rule: A lower CPL is useful only when downstream quality stays stable or improves.
The most important distinction is between acquisition efficiency and revenue efficiency. Acquisition efficiency includes traffic, visitor-to-lead conversion, spend, and CPL. Revenue efficiency includes qualified opportunities, cost per SQL, customer acquisition cost, and lead-to-customer conversion. A campaign can win the first group and lose the second.
The diagnostic chain
Use this sequence when performance looks confusing:
- Traffic: Did the channel attract the intended audience?
- Response: Did the landing page or pre-sell experience give visitors a reason to identify themselves?
- Qualification: Did those leads meet your MQL criteria?
- Sales readiness: Did they become SQLs accepted by sales?
- Revenue: Did they become customers at an economically sensible cost?
The chain also prevents premature optimization. If the visitor-to-lead rate is weak, changing sales scripts won't fix the immediate problem. If leads are plentiful but MQL-to-SQL performance is poor, buying more traffic may only increase waste. If qualified leads are healthy but closed-won results lag, response speed, offer fit, or sales execution deserves attention.
For DTC brands, this framework applies even when the funnel uses an email capture, product quiz, sample request, consultation form, or SMS opt-in rather than a traditional B2B form. The labels may differ, but the question remains the same: where does intent weaken between first click and purchase?
How the Lead Generation Funnel Really Works
Think of the funnel as a store journey. A person walking past the shop is a visitor. Someone who enters and leaves contact details is a lead. A person who fits your audience and shows meaningful interest becomes a marketing-qualified lead, or MQL. A lead who meets the sales team's acceptance standard becomes a sales-qualified lead, or SQL. The customer reaches the checkout and pays.
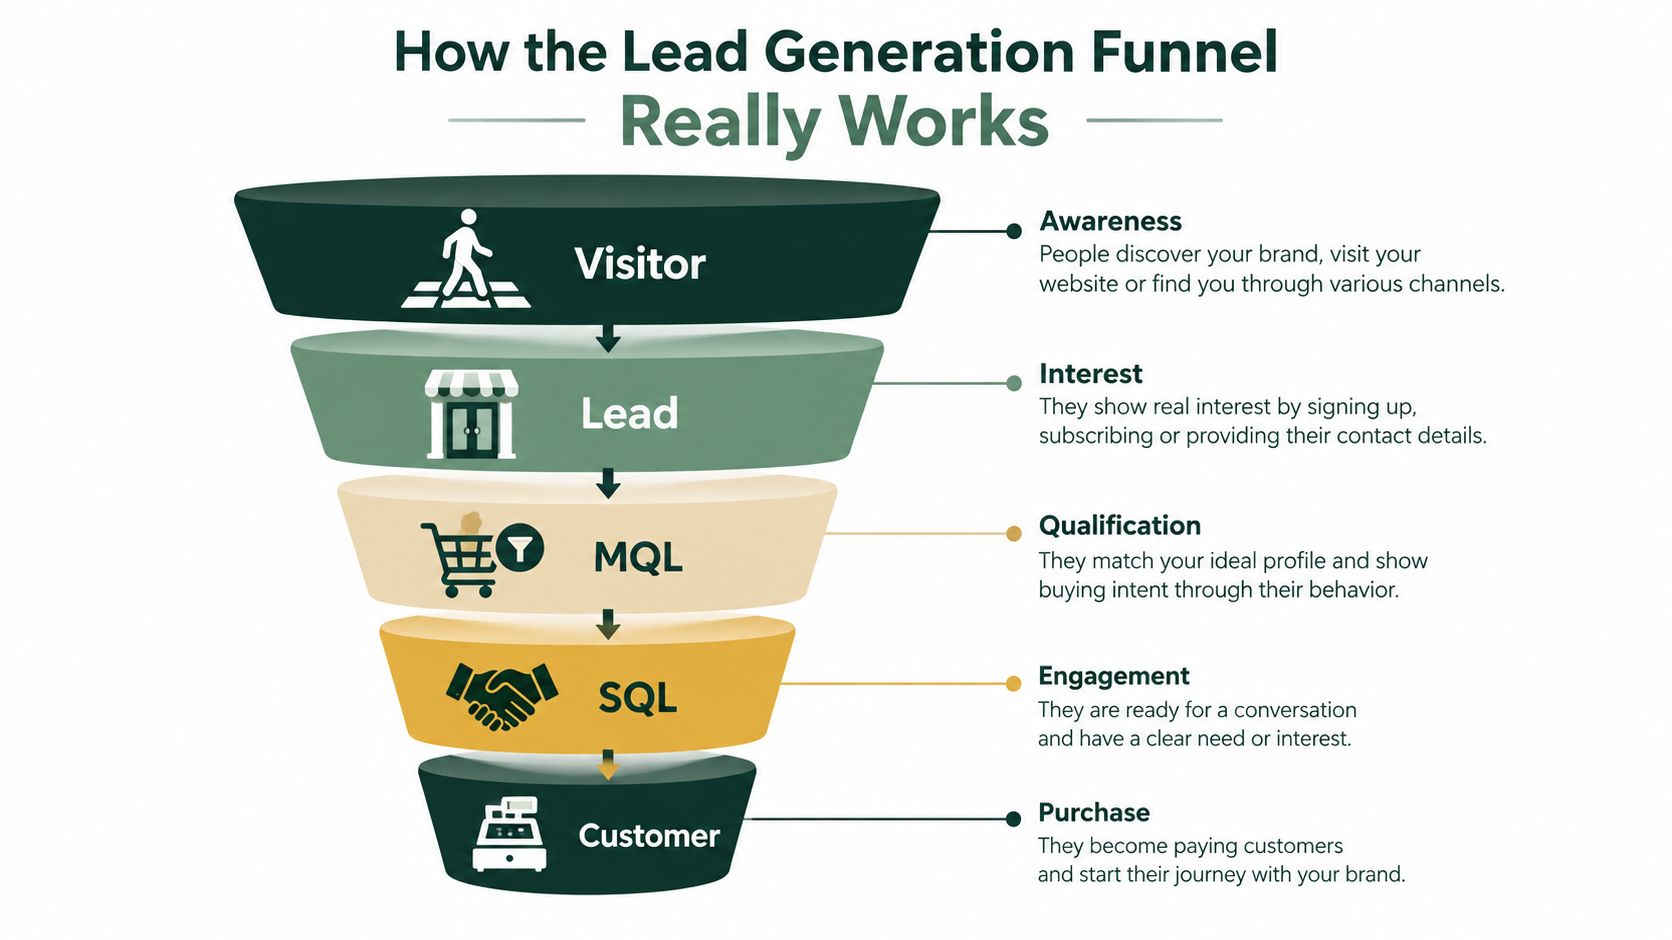
Each stage needs its own denominator. Visitor-to-lead conversion divides leads by visitors, not by ad impressions. MQL-to-SQL conversion divides accepted SQLs by MQLs. Lead-to-customer conversion divides customers by leads. Mixing those denominators creates attractive but meaningless reports.
Five stages, five questions
Visitor: Did the source deliver people with a plausible reason to care? Paid social usually interrupts attention, while search often captures an existing problem or product intent. The same landing page can perform differently because the visitor arrives with a different mental context.
Lead: Did the experience earn a clear response? A lead might submit an email, complete a quiz, request information, or start a consultation. Define the event before you calculate the rate.
MQL: Does the lead fit your agreed qualification rules? Criteria might include product need, geography, company type, behavior, or declared purchase timing. Without a shared definition, the MQL count becomes a marketing preference rather than a useful operating signal.
SQL: Has sales accepted the opportunity for active follow-up? This stage separates marketing interest from sales-ready demand. A lead can be engaged without being ready for a conversation.
Customer: Did the original lead cohort generate a completed purchase? Track this against the lead's source and acquisition period, because a customer may convert later than the month in which the lead first entered.
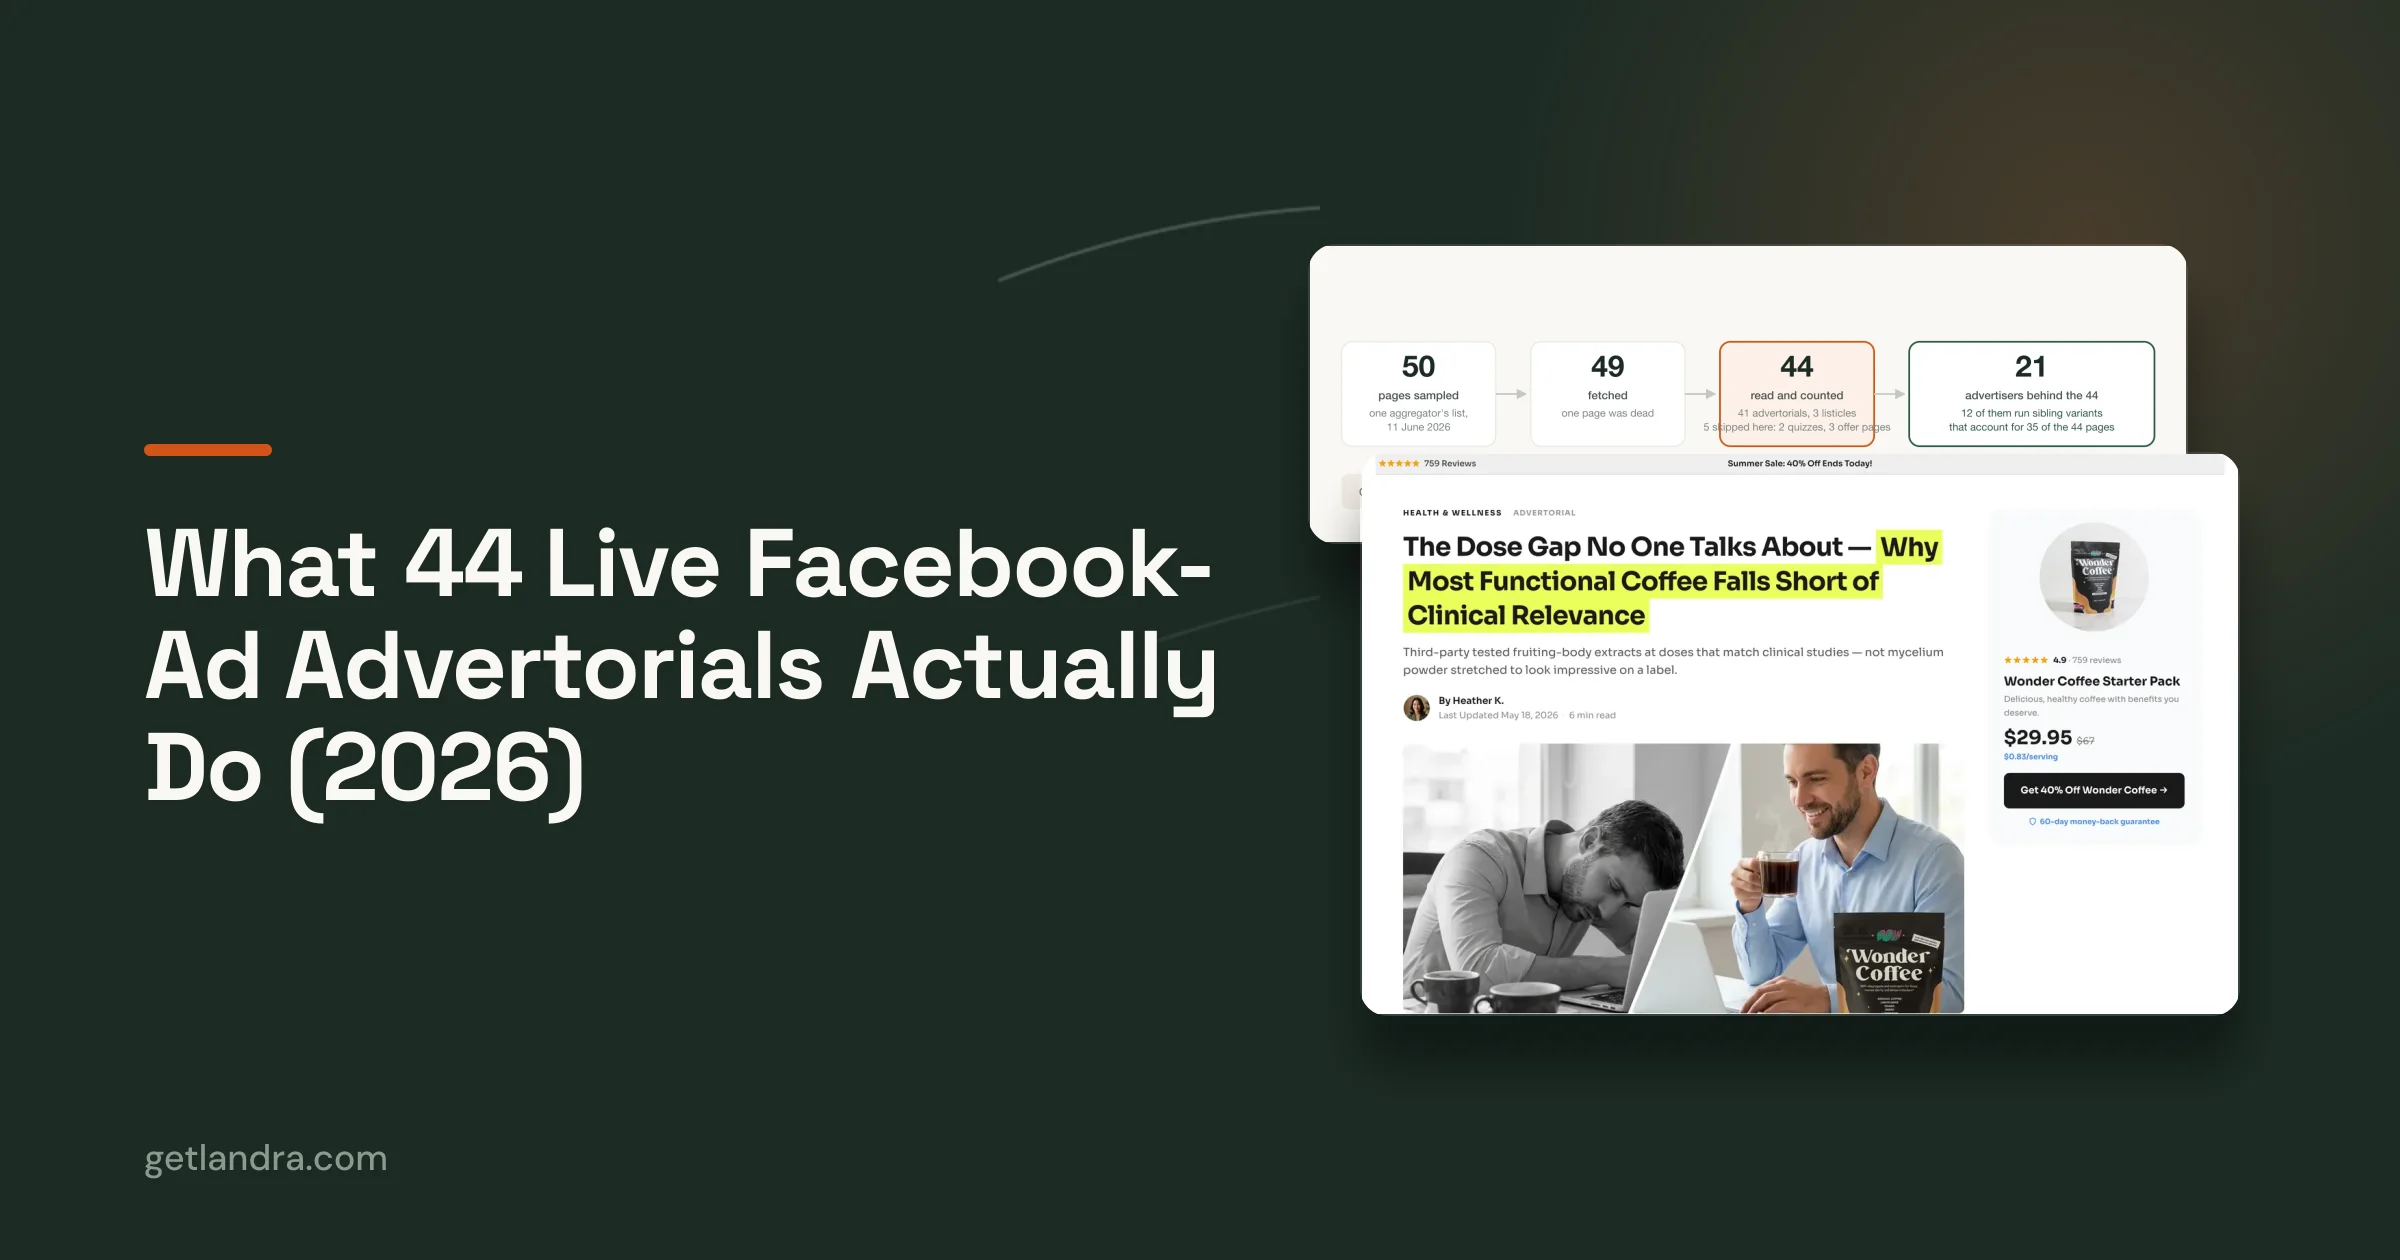
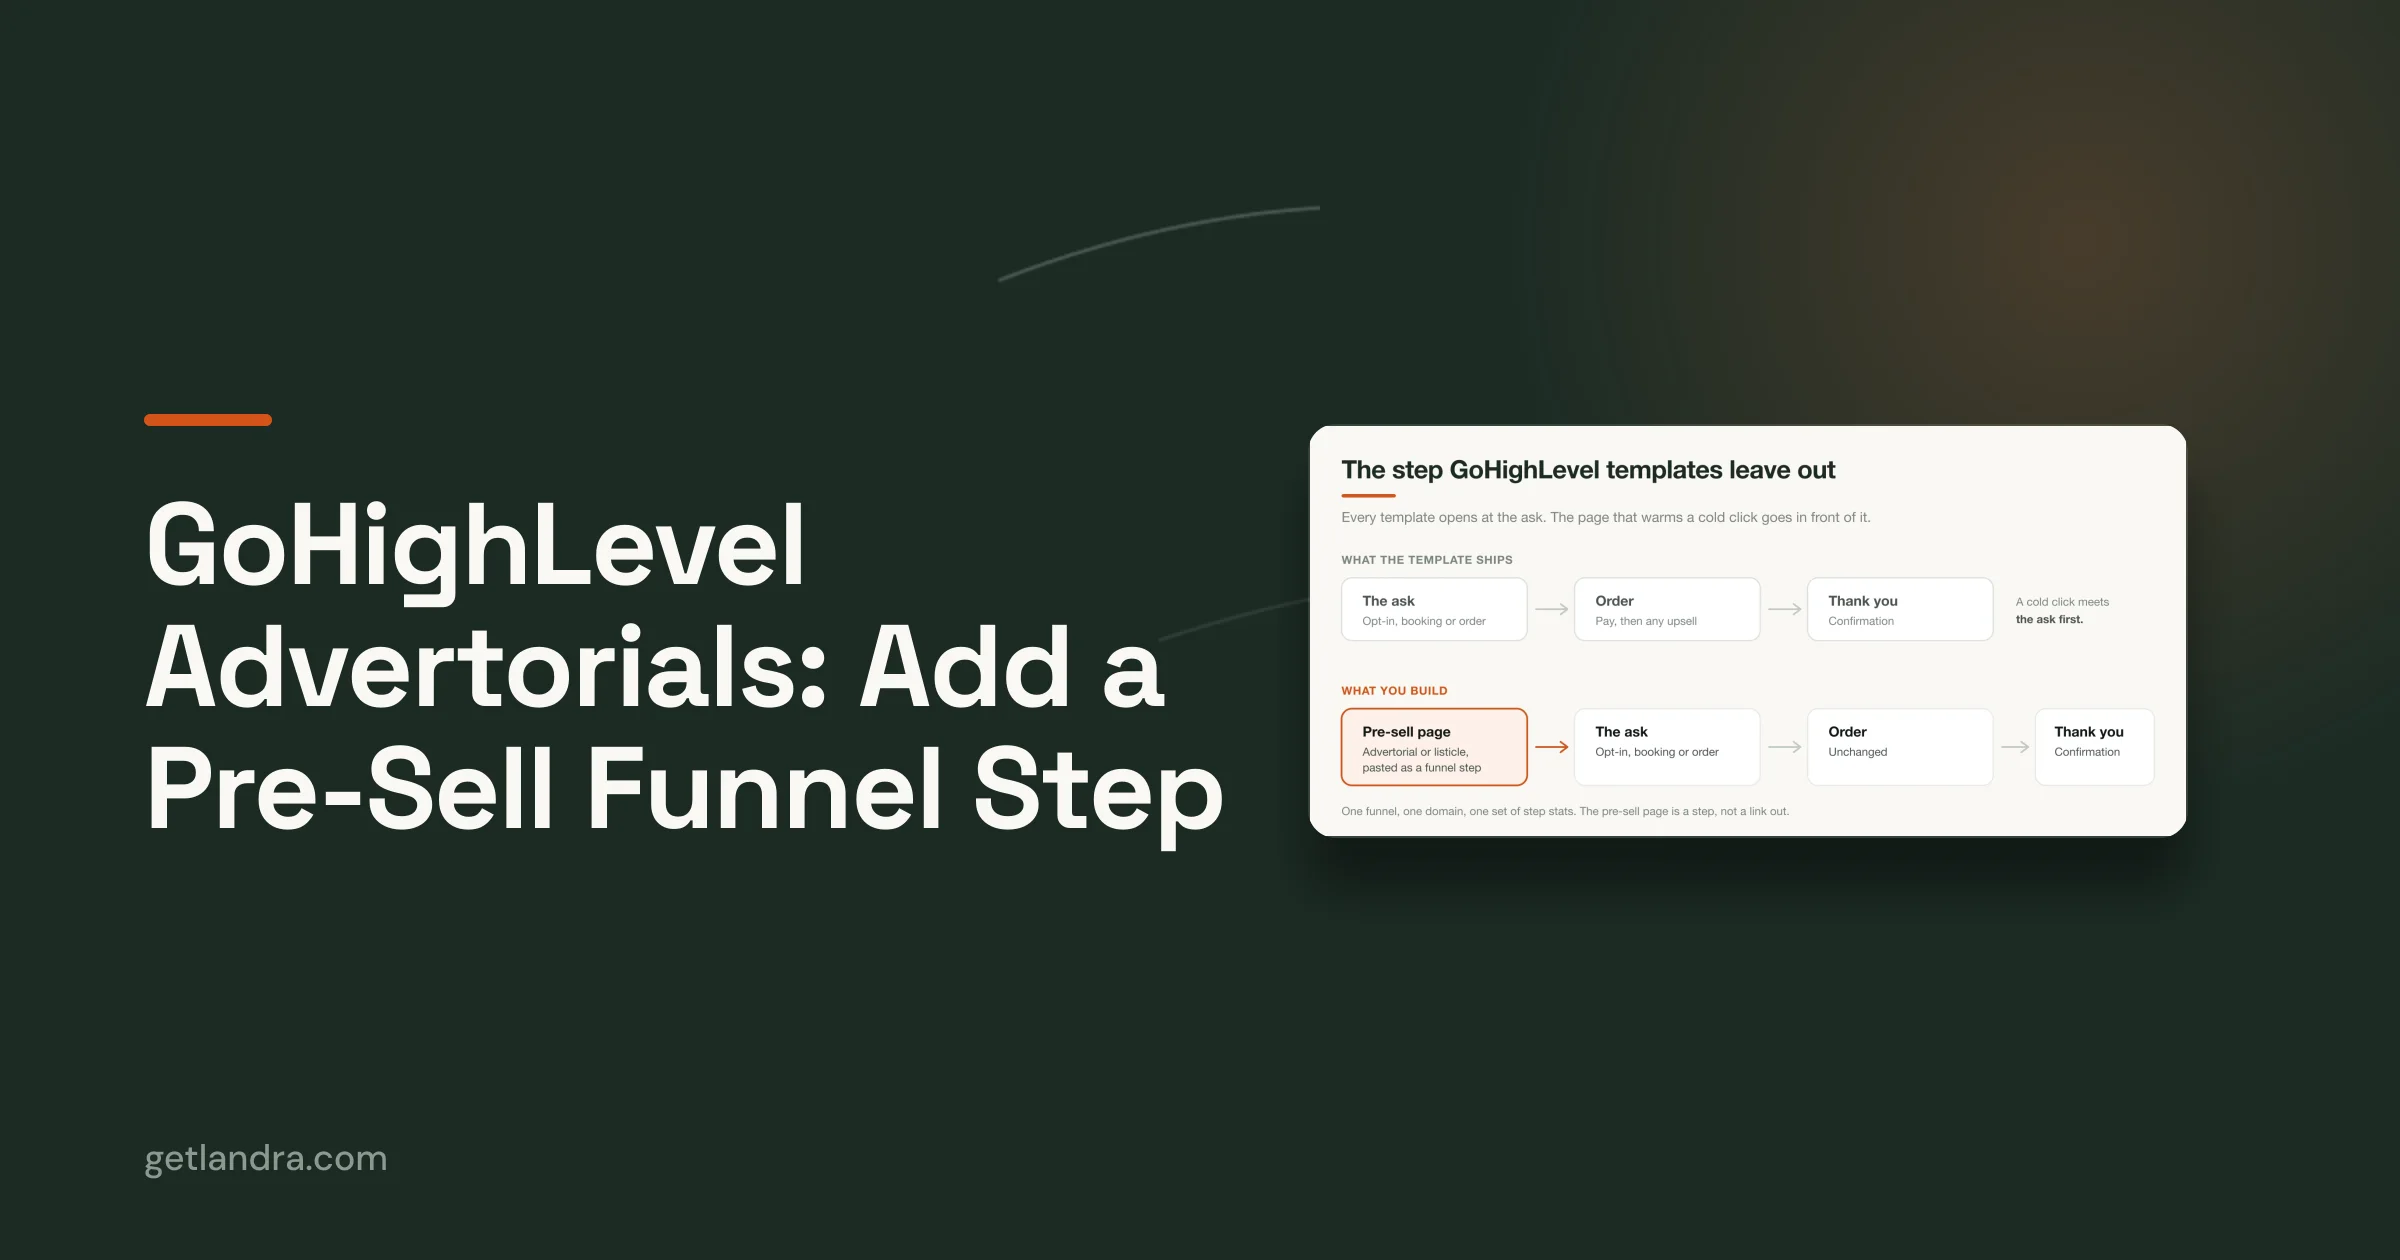
A page that warms up cold visitors before the product detail page can sit between the ad click and the lead event. These pre-sell pages from Landra illustrate why the intermediate experience deserves its own measurement rather than being treated as invisible assistive content.
The funnel isn't a one-way pipe. Some leads need education, others need a faster sales response, and some should be excluded. The useful KPI system records those differences instead of forcing every contact into the same path.
Core Lead Generation KPIs and How to Calculate Them
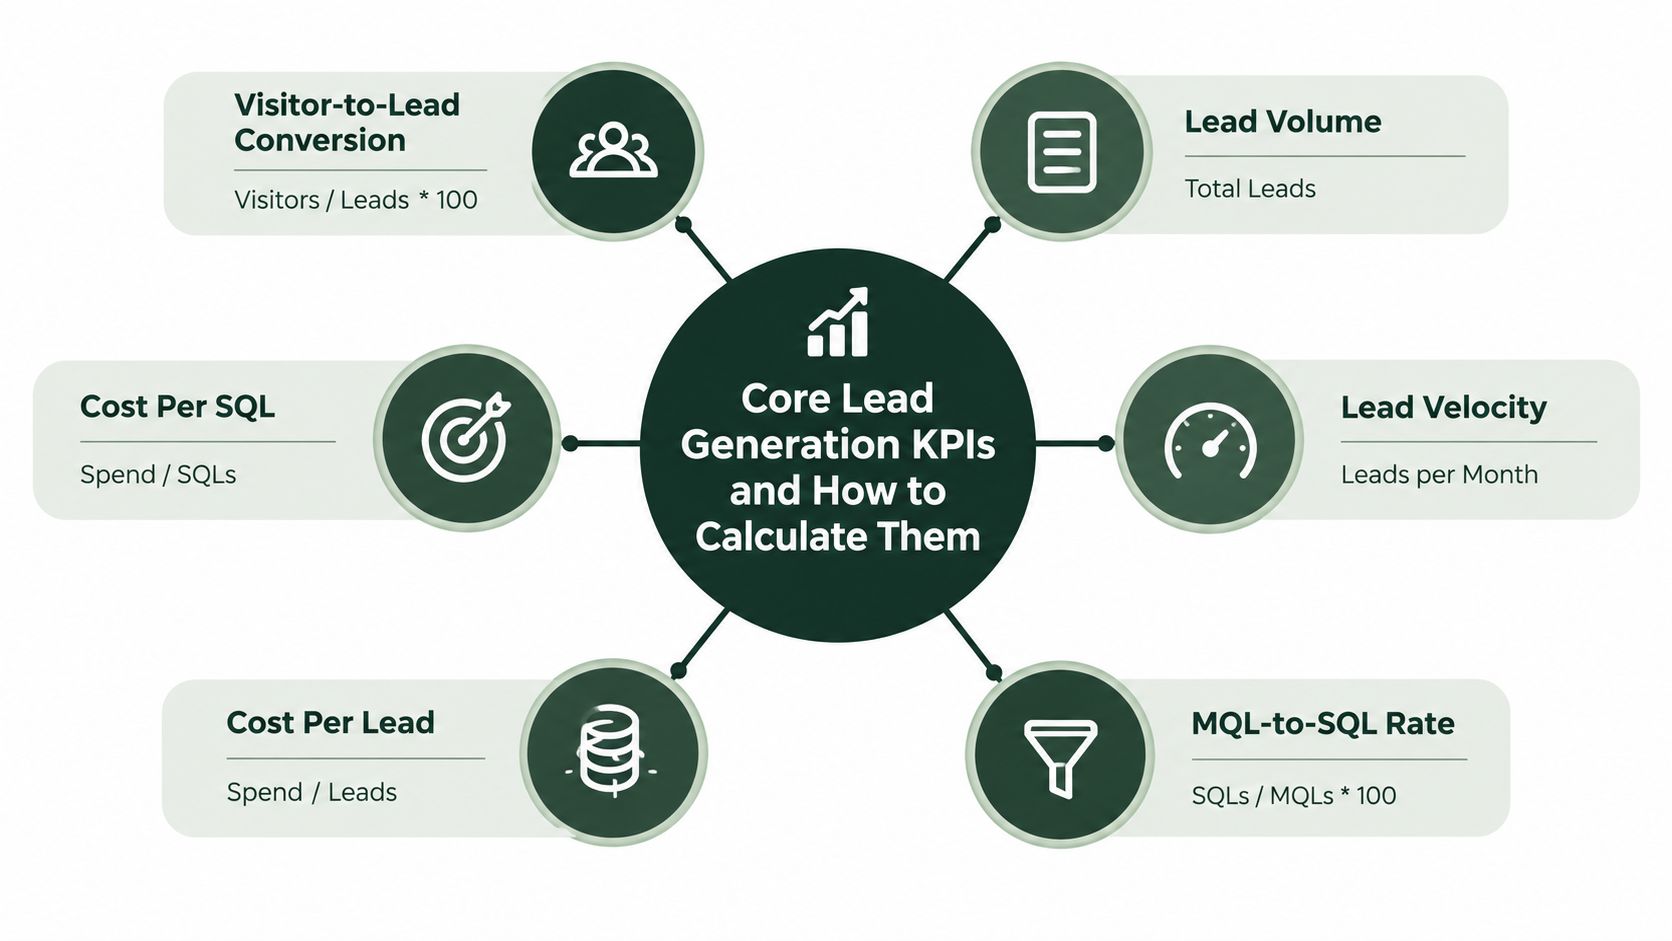
A campaign can generate leads while losing money. Start with the metrics that connect each funnel step to revenue, and keep every formula visible in the dashboard so teams apply the same definitions.
Top-of-funnel efficiency
Visitor-to-lead conversion rate equals leads divided by visitors, multiplied by 100. A page with 1,000 visitors and 29 leads converts at 2.9%. Visitor-to-lead conversion is reported at 2.9% across industries, and lead-to-customer conversion at 2.9% in the same dataset, according to lead generation conversion-rate data from Prospeo. Treat that figure as a reference, because audience intent, offer, and page experience can change the result substantially.
Lead volume counts new leads during a defined period. It shows how much demand entered the system, but says little about its value. Pair it with lead velocity, which tracks how quickly qualified leads enter the pipeline. A rising lead count with slower velocity can indicate a temporary traffic spike or a growing backlog.
Time to conversion measures the elapsed time from a consistent starting event, such as the first visit or first click, to the lead event. It separates campaigns that produce immediate responses from journeys that need education. Changing the starting event makes channel comparisons unreliable.
Qualification and revenue movement
MQL-to-SQL rate equals SQLs divided by MQLs, multiplied by 100. For B2B SaaS, reported averages sit around 13%, with variation from 11% in fintech to 26% in business insurance and 23% in eCommerce (Prospeo's MQL criteria benchmarks). Use this metric to examine both lead quality and the rules that assign qualification.
Lead-to-customer rate equals customers divided by leads, multiplied by 100. A reported benchmark is 2.9% across 14 industries, while broader cross-industry averages commonly range from 2% to 5%. At 2.9%, roughly 34 leads correspond to one customer; at 2.0%, roughly 50 leads do. These figures are planning baselines, not targets.
Cost and speed
CPL equals total campaign spend divided by leads. Cost per SQL includes ad spend, content, tooling, and SDR labor, divided by accepted SQLs. It therefore shows the cost of creating sales-accepted demand, rather than the cheaper cost of collecting contact details. B2B guidance places cost per SQL between $150 and $600, while some SaaS datasets report CPL around $237 (Tomba's B2B lead-generation KPI guidance).
CAC includes the marketing and sales costs required to acquire a customer. Revenue per lead divides attributable revenue by leads, while LTV estimates the value generated over the customer relationship. DTC teams should read these alongside contribution margin, refunds, and repeat purchases. The overview of ecommerce KPIs that drive profit connects acquisition measures with commercial outcomes.
Use a DTC conversion rate guide to check the arithmetic, then verify each event against CRM and analytics records. A low CPL can be acceptable when downstream quality is strong. A high CPL can still work when conversion speed, customer value, and margin justify it.
Segmenting KPIs by Channel and Landing Page Type
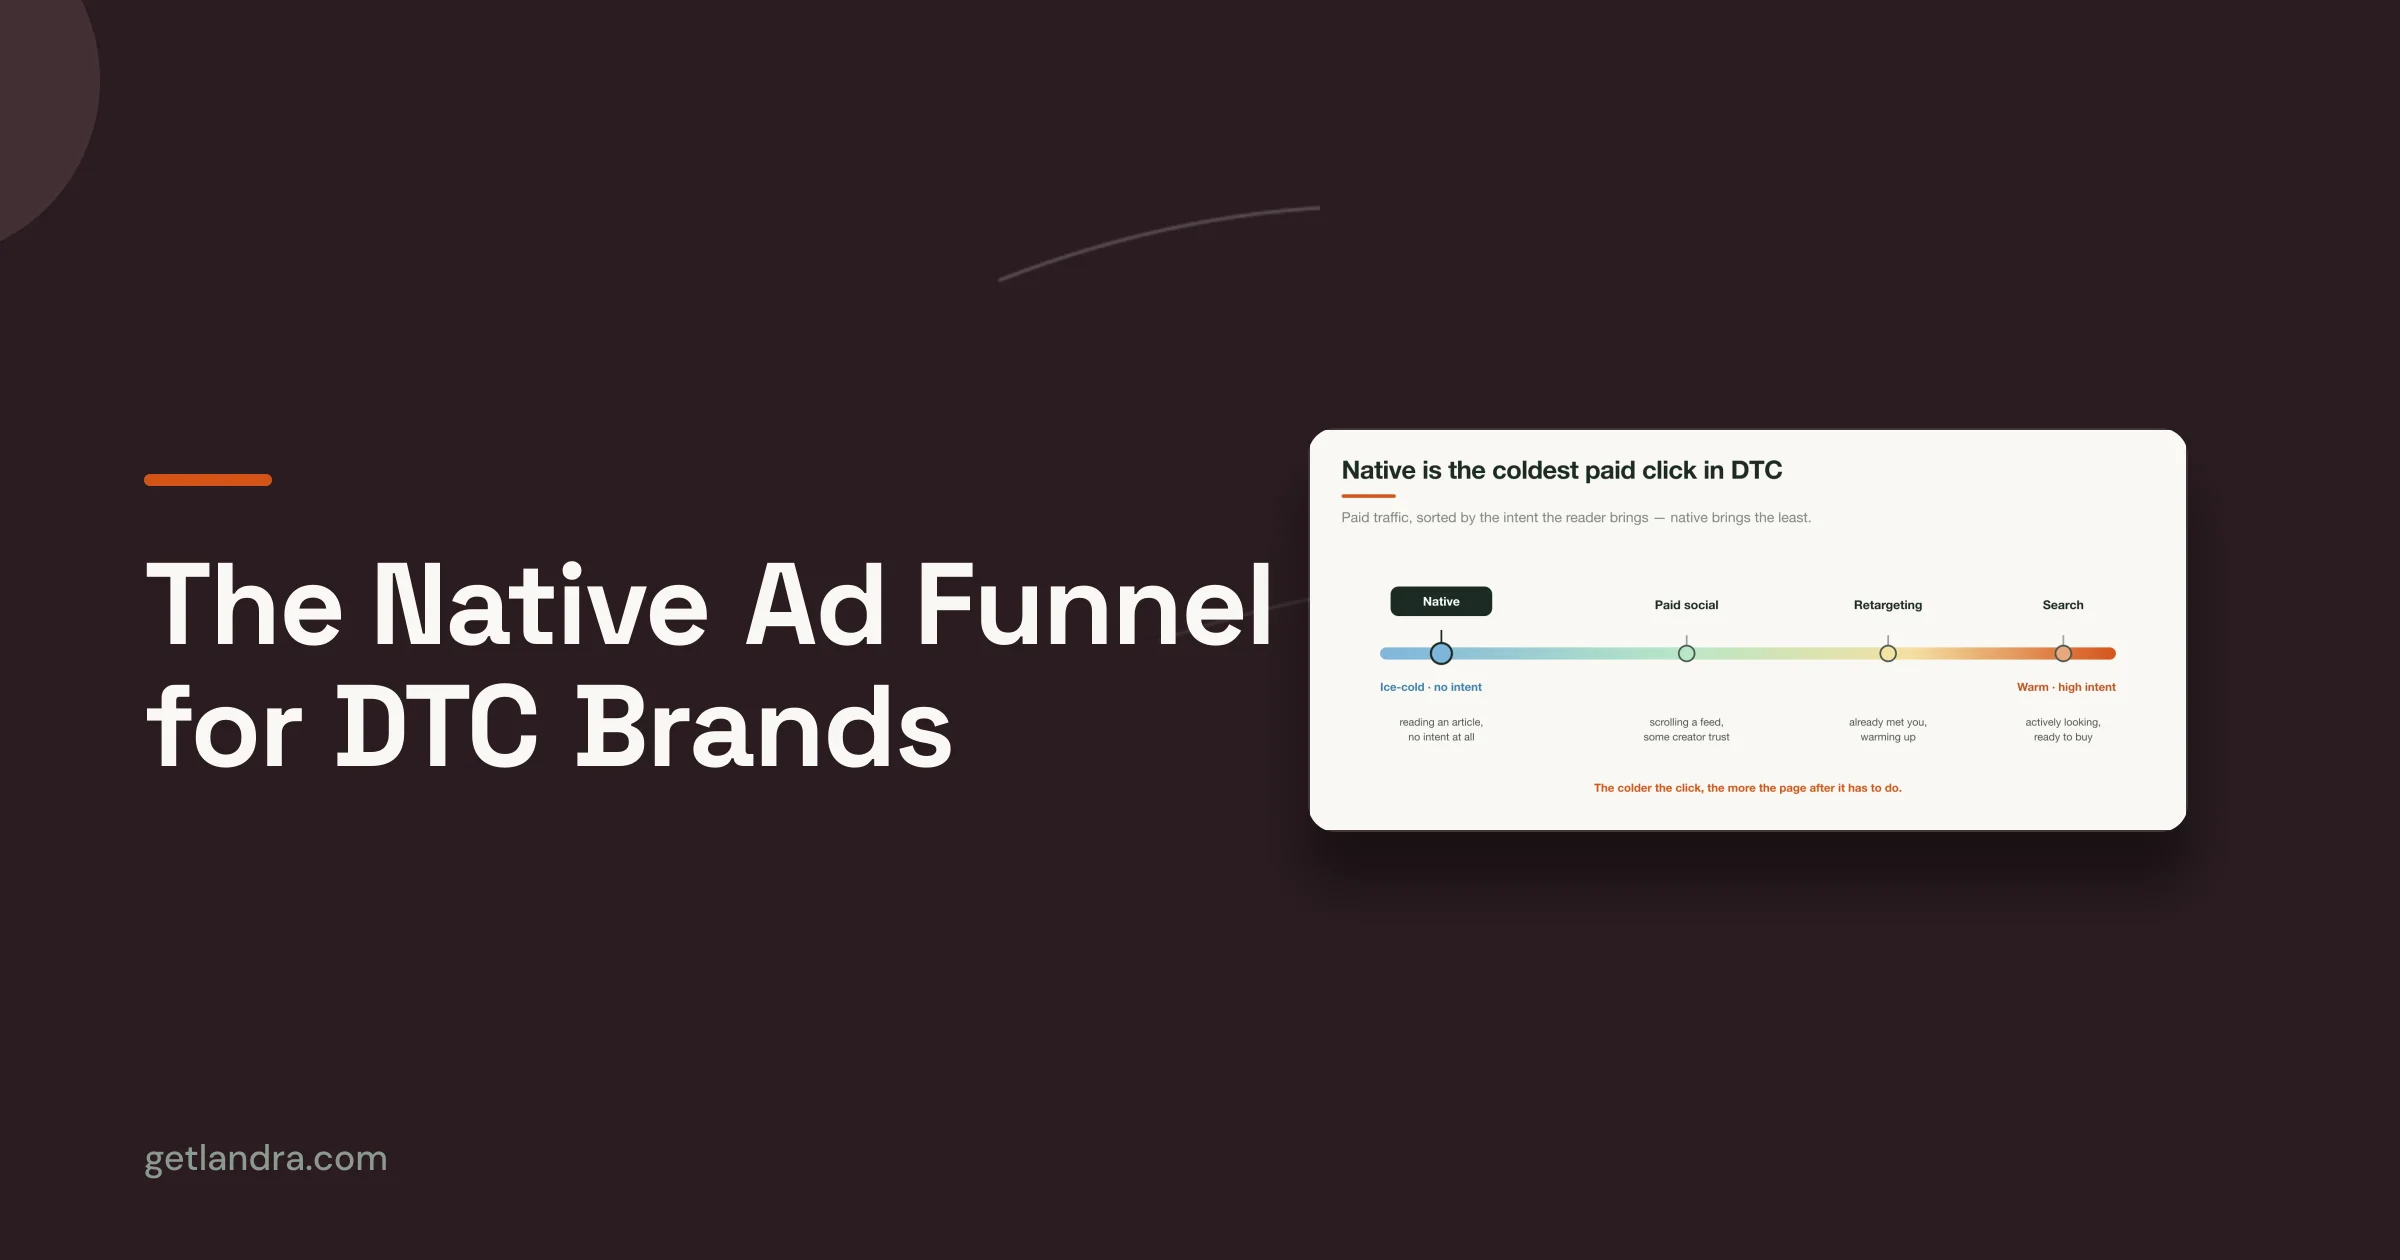
An all-channel CPL can make a weak funnel look efficient. Paid social, search, and organic visitors arrive with different levels of awareness, so one blended average cannot explain where revenue is being lost. A cold Meta visitor may need education, proof, and a clear reason to opt in. A high-intent search visitor may convert on a direct product or problem-solving page.
Segment performance by traffic source, campaign intent, and page type. Start with visitor-to-lead rate and CPL for each cohort. Add MQL-to-SQL and lead-to-customer results after the cohort has had time to mature. The goal is a diagnostic chain, from traffic quality to revenue, rather than a race to the lowest acquisition cost.
| Segment | Visitor to Lead Rate | CPL Range | MQL to SQL Rate |
|---|---|---|---|
| Paid social, cold audience, pre-sell page | Measure by campaign and page variant | Measure by spend and leads | Compare after qualification |
| Paid social, cold audience, product page | Measure separately from pre-sell traffic | Measure separately | Compare downstream quality |
| Search, high-intent query | Measure by query and landing page | Measure by campaign intent | Compare accepted SQL yield |
| Organic, educational content | Measure by content cluster | Include content and distribution costs where relevant | Compare lead maturity |
| Retargeting | Measure by audience window and offer | Compare against incremental spend | Compare customer progression |
The table uses measurement fields instead of fixed targets. Verified benchmark data reports visitor-to-lead conversion at about 2.9% overall, with variation near 7% for legal pages, around 4% for healthcare, and 1% to 3% for SaaS. It also reports CPL ranging from $30 to $200, depending on market and channel (Swydo's lead-generation KPI benchmarks). These differences make aggregate reporting dangerous because a channel can produce volume while contributing fewer qualified opportunities.
Why page type changes the diagnosis
A generic product page asks a cold visitor to understand the product, trust the brand, assess the offer, and act in one step. A pre-sell advertorial or listicle handles the education first, matches the ad's angle, and introduces the product once the visitor has a clearer reason to continue. That structure does not guarantee better performance. It gives you a specific hypothesis to test.
Track each variant with its own UTM content value, page identifier, and form event. Compare qualified-lead rate, response speed, revenue per lead, and customer quality, not leads alone. A page with higher CPL may produce stronger economics if its prospects qualify faster, convert at a higher rate, or generate more customer value.
A cheap lead from the wrong audience is deferred acquisition cost.
For DTC testing, hold the offer and audience stable while changing the pre-sell angle or page structure. Otherwise, the result could reflect the message, traffic mix, or commercial offer rather than the page itself. Weight each cohort by the outcome it is meant to improve: volume for reach, quality for sales acceptance, and speed when delayed follow-up reduces conversion.
Benchmarks and Diagnostics That Reveal Funnel Health
Benchmarks should prompt investigation, not act as universal pass or fail grades. Visitor-to-lead conversion is often reported around 2.9% overall, with variation by vertical. Broader landing-page summaries place typical conversion around 2% to 6.6%, while top performers exceed 10% (CUFinder's lead-generation metrics overview). Use these figures as context, then compare cohorts with similar intent, channel, and page type.
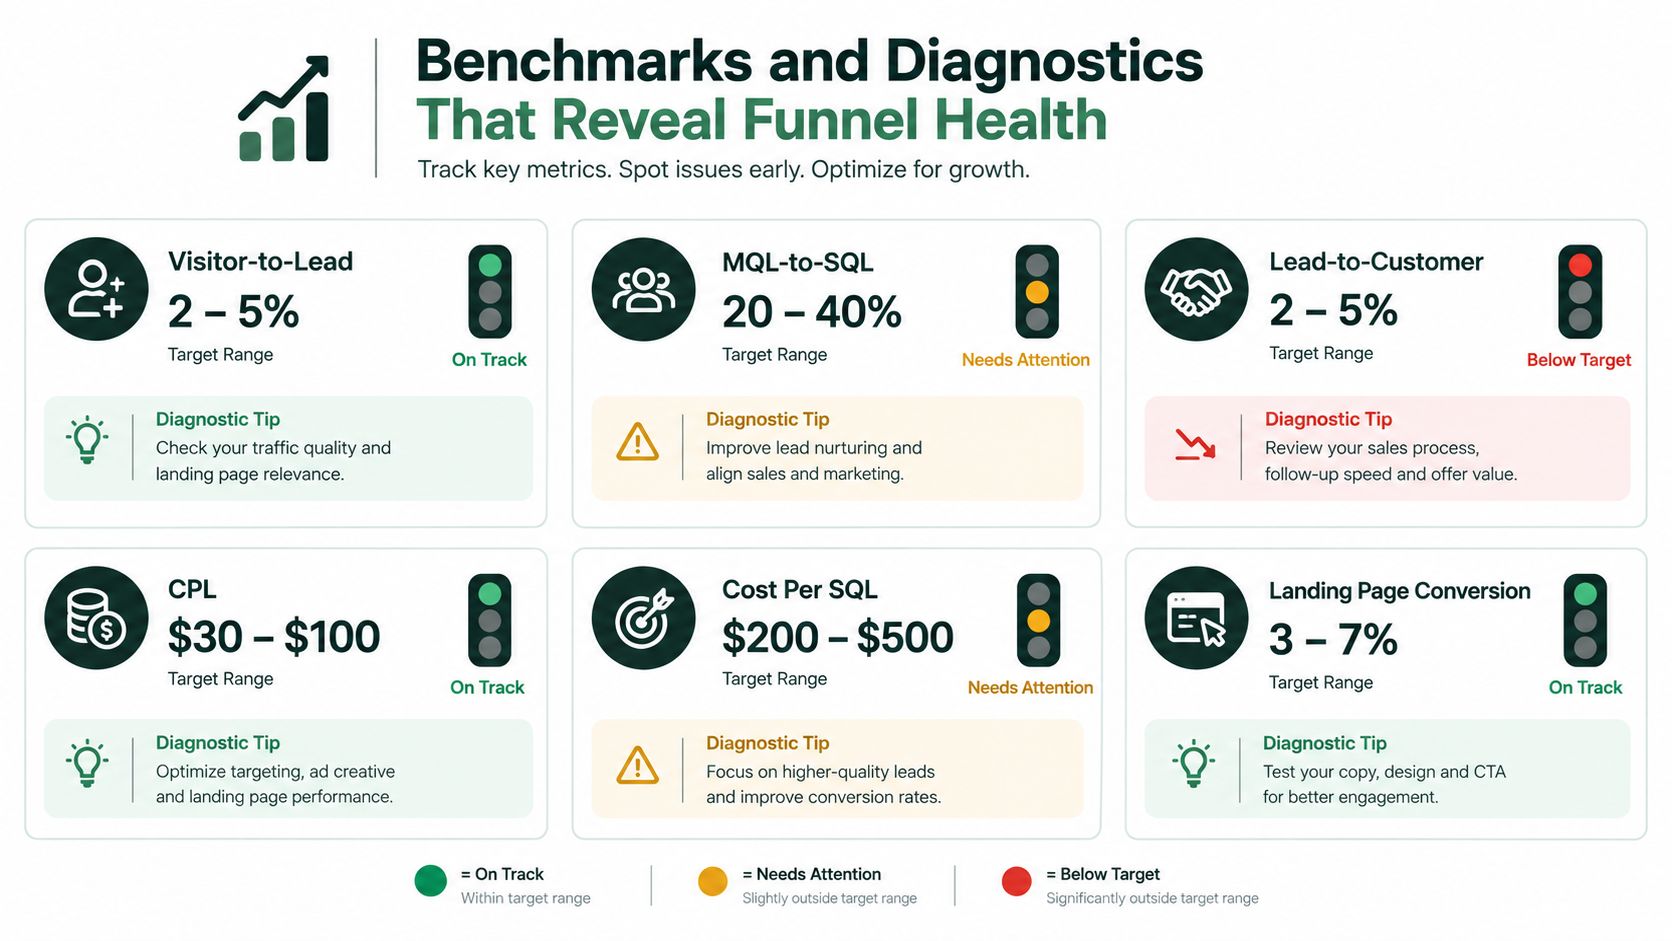
A B2B SaaS funnel may use 13% MQL-to-SQL as a reference, while broader guidance places MQL-to-SQL between 13% and 25% and lead-to-customer between 2% and 5%. Treat those ranges as directional. Cost-per-SQL can also vary widely, with one benchmark source reporting ranges between $150 and $600. Neither benchmark replaces your own unit economics.
Read patterns, not isolated numbers
High visitor-to-lead rate, weak MQL-to-SQL: The page persuades visitors, but the audience or offer attracts poor-fit responses. Review targeting, the ad promise, form questions, and qualification rules.
Low CPL, weak lead-to-customer rate: A low acquisition cost may reflect many low-intent leads rather than efficient growth. Compare cost per SQL and revenue per lead before increasing spend.
Healthy MQL-to-SQL, weak customer conversion: Marketing may be reaching suitable prospects, while follow-up, pricing, product fit, or offer framing limits closed-won results.
Strong page conversion, slow pipeline: Leads may wait too long for contact, or nurture may lack a clear next action. Report response time and stage lag beside conversion rates.
Warmly reports a more difficult B2B pattern, including median B2B CPL at $213, MQL-to-SQL at 9.8%, and lead-to-closed-won conversion at 0.94% in its cited 2026 benchmark discussion (Warmly's lead-generation metrics analysis). Do not copy these figures as targets. Use them to question whether rising lead volume is hiding weaker downstream yield.
Judge campaigns by the cohort that created the lead, not only by the month when revenue arrived. A lead generated recently may need time to qualify, while an older cohort may receive credit for later revenue. Cohort reporting keeps those delays from distorting performance.
For page-level analysis, pair advertorial conversion metrics with qualification and revenue data. A page-level win matters only when its improvement continues through sales and produces stronger customer economics.
Tracking Setup and Dashboard Design for Reliable KPIs
A dashboard can make a broken funnel look precise. Reliable reporting begins with a shared measurement plan that defines each event and stage transition before data reaches the dashboard. Shopify or Webflow, ad platforms, analytics tools, email systems, and CRMs may all use “lead” differently, so agree on one definition and one naming system.
Capture the events
Track the first meaningful acquisition event, landing-page view, form start, form completion, quiz completion, MQL acceptance, SQL acceptance, purchase, refund, and revenue value. Save the original source and campaign with the lead, alongside later sessions. This preserves the path that created the cohort instead of assigning every result to the latest click.
Use a consistent UTM structure. Keep source, medium, campaign, content, and term values readable. Reserve content for the ad or page variant. Capitalization matters too. “Spring prospecting” and “Spring Prospecting” can become separate rows, splitting one cohort and weakening comparisons.
Map the handoffs
Make MQL and SQL definitions operational in the CRM. Marketing may score or route a lead, while sales records whether it was accepted, rejected, or returned, with a reason. Labels such as poor fit, duplicate, unreachable, or wrong timing turn a weak rate into specific causes the team can investigate.
Store stage dates, not just current statuses. A lead created today may become an SQL later and a customer after further sales activity, so a calendar-month snapshot can misrepresent funnel performance. Cohort and stage-date views keep acquisition timing separate from revenue timing.
Build two dashboard views
Acquisition view: Show spend, visitors, leads, visitor-to-lead rate, CPL, page variant, channel, and audience. Use it to examine traffic quality, message fit, and pre-sell page performance. A high lead count may still be weak if qualified progression falls.
Revenue view: Show MQLs, SQLs, MQL-to-SQL rate, cost per SQL, pipeline value, customers, lead-to-customer rate, CAC, revenue per lead, speed to lead, and time to conversion. Cost per SQL should include ad spend, content, tooling, and SDR labor when those costs belong to the acquisition process, giving a fuller view of pipeline cost than CPL alone.
Filter both views by source, page type, campaign intent, device, geography, and lead date. DTC teams should compare volume, quality, and speed by channel and pre-sell page, rather than letting cheap CPL win automatically. A useful dashboard answers an action question, such as “Which cold-traffic page creates the strongest qualified cohort?” Totals alone create a scoreboard. Segmented cohorts create a decision tool.
Turning KPI Insights Into Higher Converting Funnels
A low CPL can hide an expensive funnel. Once the full path is visible, optimization becomes a bottleneck exercise. Find the earliest stage where results fall below comparable cohorts, then test the smallest change that could explain the gap. Changing five elements at once makes the outcome difficult to interpret.
Choose the right intervention
Weak traffic quality calls for tighter audience targeting and closer alignment between the ad promise and the page. A weak visitor-to-lead rate points to the headline, proof, form length, offer, or page type. If MQL-to-SQL quality is poor, review qualification rules and lead-source fit instead of cutting CPL. Healthy SQL volume with weak customer conversion shifts attention to follow-up, objections, pricing, or product experience.
Speed belongs in the same diagnostic chain. Current benchmark coverage increasingly discusses speed-to-lead under five minutes and pipeline velocity as operational measures, while landing-page benchmarks vary widely by context. A fast reply cannot rescue a poor-fit lead, yet a qualified lead can lose momentum while waiting for contact.
For DTC teams, test one message angle at a time across the pre-sell experience. Compare opt-in rate with qualified progression, because a page can win the first conversion while producing weaker downstream cohorts. Landra can generate editable advertorial and listicle pre-sell pages from a product URL, publish them to Shopify, Webflow, a hosted URL, or HTML, and duplicate variants for controlled testing. An AI-powered lead qualification guide can support decisions about routing and follow-up workflows.
Close each review with five questions:
- Traffic: Which source and intent group entered the funnel?
- Page: Which variant turned attention into a response?
- Quality: Which cohort produced accepted MQLs and SQLs?
- Speed: How quickly did the team respond and progress the lead?
- Revenue: Which original cohort produced customers and revenue?
Record the answers in the dashboard. Pause tests that improve only CPL, and promote changes that strengthen the complete path from click to customer.
Landra helps DTC brands generate editable advertorial, listicle, and other pre-sell landing pages from a product URL, then publish variants to Shopify, Webflow, a Landra URL, or HTML. Use Landra to test page angles alongside visitor-to-lead, qualification, speed, and revenue KPIs instead of judging paid traffic by CPL alone.