

Stop looking for the one best attribution model. That popular advice sends DTC teams hunting for a winner, when the problem is asking one reporting rule to diagnose campaigns, prove causality, and set budgets. Attribution modeling works better as a stack of decision systems, with each layer answering a different question and carrying different evidence.
Table of Contents
- Why Attribution Alone Cannot Prove Growth
- Understanding How Attribution Modeling Works
- Comparing Attribution Model Types
- Implementing Attribution Tracking in GA4
- Attribution Examples for Paid Social Journeys
- Testing Incremental Lift With Controlled Experiments
- Building a Complete Measurement Stack
- Recommended Attribution Decisions for DTC Teams
Why Attribution Alone Cannot Prove Growth
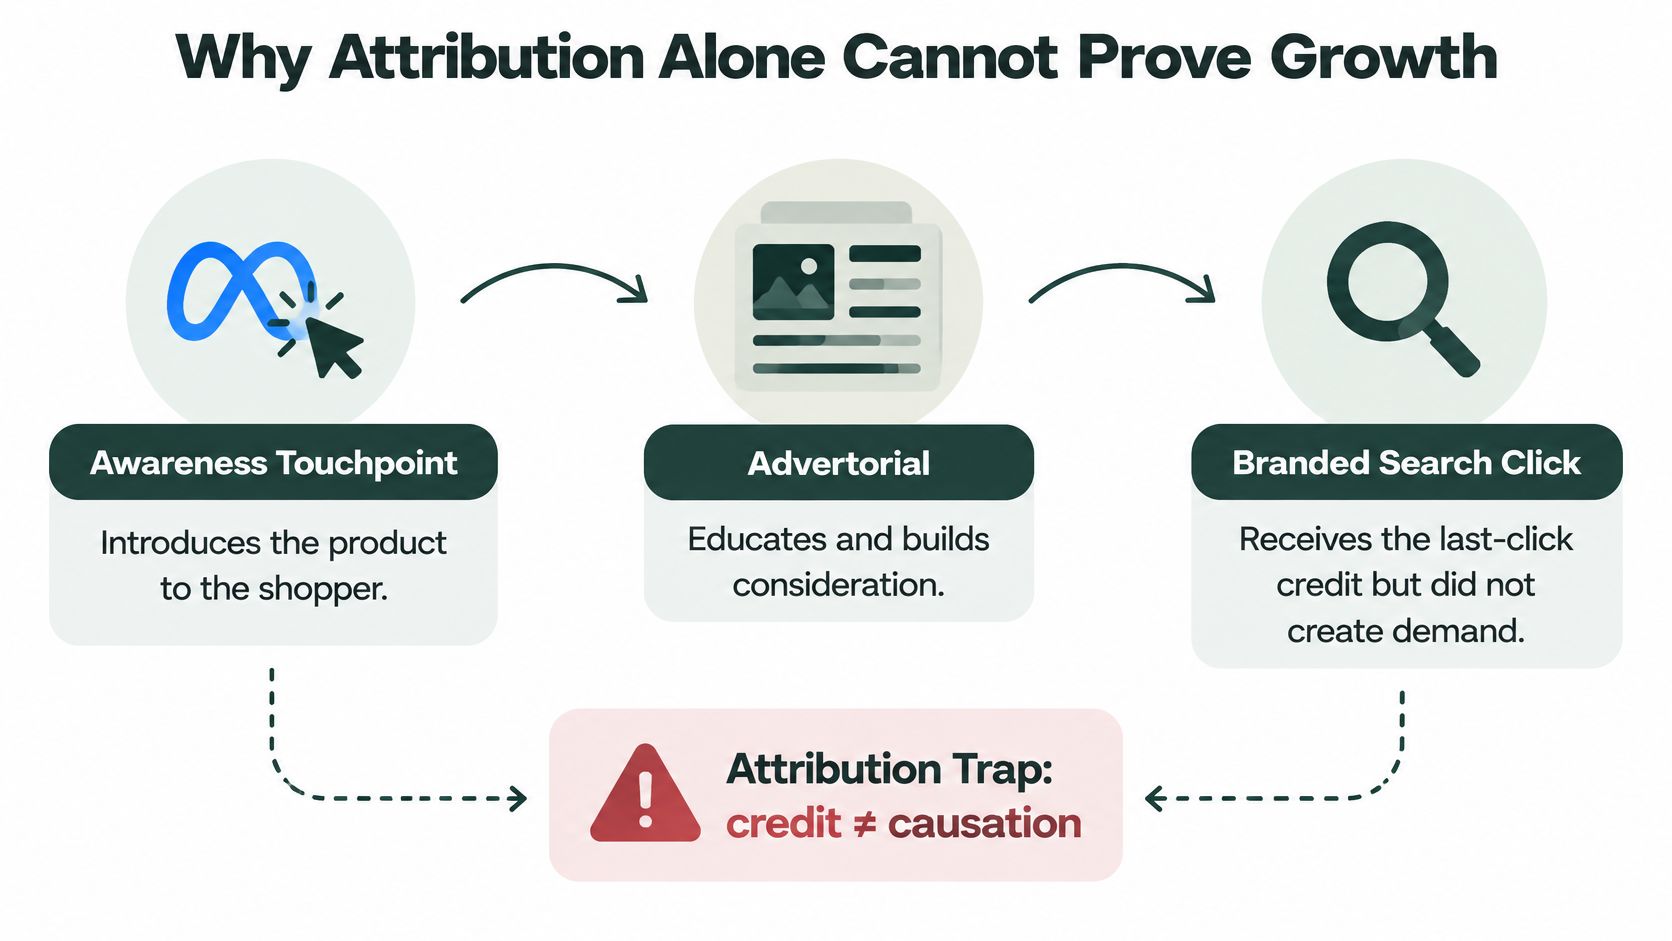
A shopper sees your product in a Meta ad, reads an advertorial that explains why it solves her problem, leaves, then searches your brand name days later and buys. Your dashboard credits branded search. That report is internally consistent, and it still tells you almost nothing about what created the sale.
That's the trap. Platform-reported credit is not proof of incremental impact. Attribution assigns a conversion to touchpoints that were observed before it happened. It doesn't test whether the customer would've bought anyway, which is the question that matters when you're deciding whether to scale spend.
Three Jobs Teams Force Into One Report
Most measurement arguments happen because three distinct jobs get collapsed into a single number.
- Understanding paths: Which ads, pages, and channels show up before purchase, and in what order?
- Estimating causal lift: Did this campaign or page cause purchases that wouldn't have happened otherwise?
- Allocating spend: Where should the next dollar go across the full channel portfolio?
Attribution handles the first job well. It's fast, granular, and useful for spotting broken journeys or underperforming creative. It can't do the second job because it has no counterfactual. It only partially does the third, because it can only value touchpoints it can see.
Credit describes where a conversion was recorded. Causation describes what changed the outcome. Treating them as the same thing is how teams cut the channels that create demand and overfund the ones that harvest it.
For presell pages, this distinction is practical, not academic. An advertorial may do its work early by building understanding and intent, then receive little credit when the shopper returns through search, direct traffic, or email. If you judge that page only by attributed conversions, you'll undervalue it. If you judge it only by its own click-through rate, you'll overstate it. You need both a path view and a causal check.
Understanding How Attribution Modeling Works
Think of a conversion path as an orchestra performance. Several instruments play at different moments, and the audience hears one result. An attribution model is the rule you use to decide how much applause each instrument receives. Implementation guides on Google's explanation of assigning conversion credit across touchpoints frame attribution the same way, as distributing credit across the interactions in a path.
Three terms carry most of the mechanics. A touchpoint is an observed interaction, such as an ad click or email open. A conversion path is the sequence of those touchpoints before a purchase. Conversion credit is the share of that purchase your model assigns to each touchpoint.

From One Touch to Shared Credit
Single-touch models give everything to one interaction. Under last click, 100% of conversion credit goes to the final interaction before a sale. Under first click, 100% goes to the interaction that started the path. Both rules are easy to explain, and both ignore most of the journey.
Multi-touch models spread credit instead. Take a typical DTC path where paid social introduces a product, the shopper returns directly to read reviews, an email brings her back, and branded search precedes checkout. A shared-credit model values each step rather than pretending only the search click mattered.
For a fuller primer on these mechanics, understanding attribution modeling from CartBoss is a useful companion read.
What the Model Cannot See
Attribution developed because single-touch reporting systematically undervalued discovery and assist interactions in multichannel journeys. But spreading credit more fairly doesn't make the underlying data complete. The model only allocates among touchpoints that were captured and stitched to the same person.
- Observed and credited: Clicks and sessions your tracking recorded
- Observed but disconnected: Visits on another device or browser that never got linked
- Never observed: Offline exposure, word of mouth, and privacy-restricted signals
That boundary is the key limit. Attribution modeling answers how to divide credit for a conversion you already recorded. It doesn't answer whether those touchpoints caused the conversion, or what happened outside the tracking layer entirely.
Comparing Attribution Model Types
Every model embeds an assumption about what contribution means. None of them discovers the truth. They apply different logic to the same path, so the right question isn't which model wins. It's which assumption fits the decision in front of you.
A milestone from Google underlines how fast this field shifted. Google removed first-click, linear, time-decay, and position-based models from Google Ads and Google Analytics 4 in November 2023, after reporting that fewer than 3% of Google Ads web conversions used those models, a change documented in Google's notice on retiring rules-based attribution models. Last click and data-driven attribution remained as the principal built-in options.
Attribution Model Decision Matrix
| Model | How credit is assigned | Useful for | Main trade-off |
|---|---|---|---|
| First click | All credit to the opening interaction | Judging which channels start journeys | Ignores everything that nurtured or closed the sale |
| Last click | All credit to the final interaction | Fast, familiar reporting on what precedes purchase | Undervalues discovery and assist touchpoints |
| Linear | Equal share to every touchpoint | A balanced view across a long path | Assumes weak and decisive touches matter equally |
| Time decay | More credit to touches nearer purchase | Short, promotion-driven buying cycles | Discounts early demand creation |
| Position-based | Extra weight to first and last touches | Valuing both discovery and closing | The middle of the journey gets compressed |
| Data-driven | Algorithmic weights from account conversion data | Adapting credit to observed behavior patterns | Less transparent and dependent on data quality |
Rules Versus Algorithms
Fixed rules are transparent. You can explain linear or position-based logic to a finance partner in one sentence, and you can audit exactly why a channel received its share. The cost is rigidity. The rule applies the same assumption whether your customer bought in an hour or took weeks.
Data-driven attribution works differently. Google's approach uses account conversion data to estimate how interactions contribute, rather than applying a predetermined formula. That adaptation is valuable when your paths are varied, but it trades away explainability. When credit shifts, you may not be able to say precisely why.
Practical rule: Use a transparent model when the team needs a shared, auditable reporting language. Use data-driven attribution when your volume and data quality support it, and treat its output as an estimate to validate, not a verdict.
Notice what this comparison can't settle. A model can be well chosen for path diagnostics and still tell you nothing about causal lift. Branded search and retargeting will look strong under most models because they sit near purchase. That pattern reflects proximity to existing intent as much as influence, which is why model choice should never be your only budget input.
Implementing Attribution Tracking in GA4
Attribution configuration can't rescue messy tracking. If your purchase event fires twice, your campaign names are inconsistent, or checkout happens on a domain that breaks the session, every model you apply will distribute credit across bad data with false confidence. Clean collection comes first, model settings second.
A Deliberate Implementation Sequence
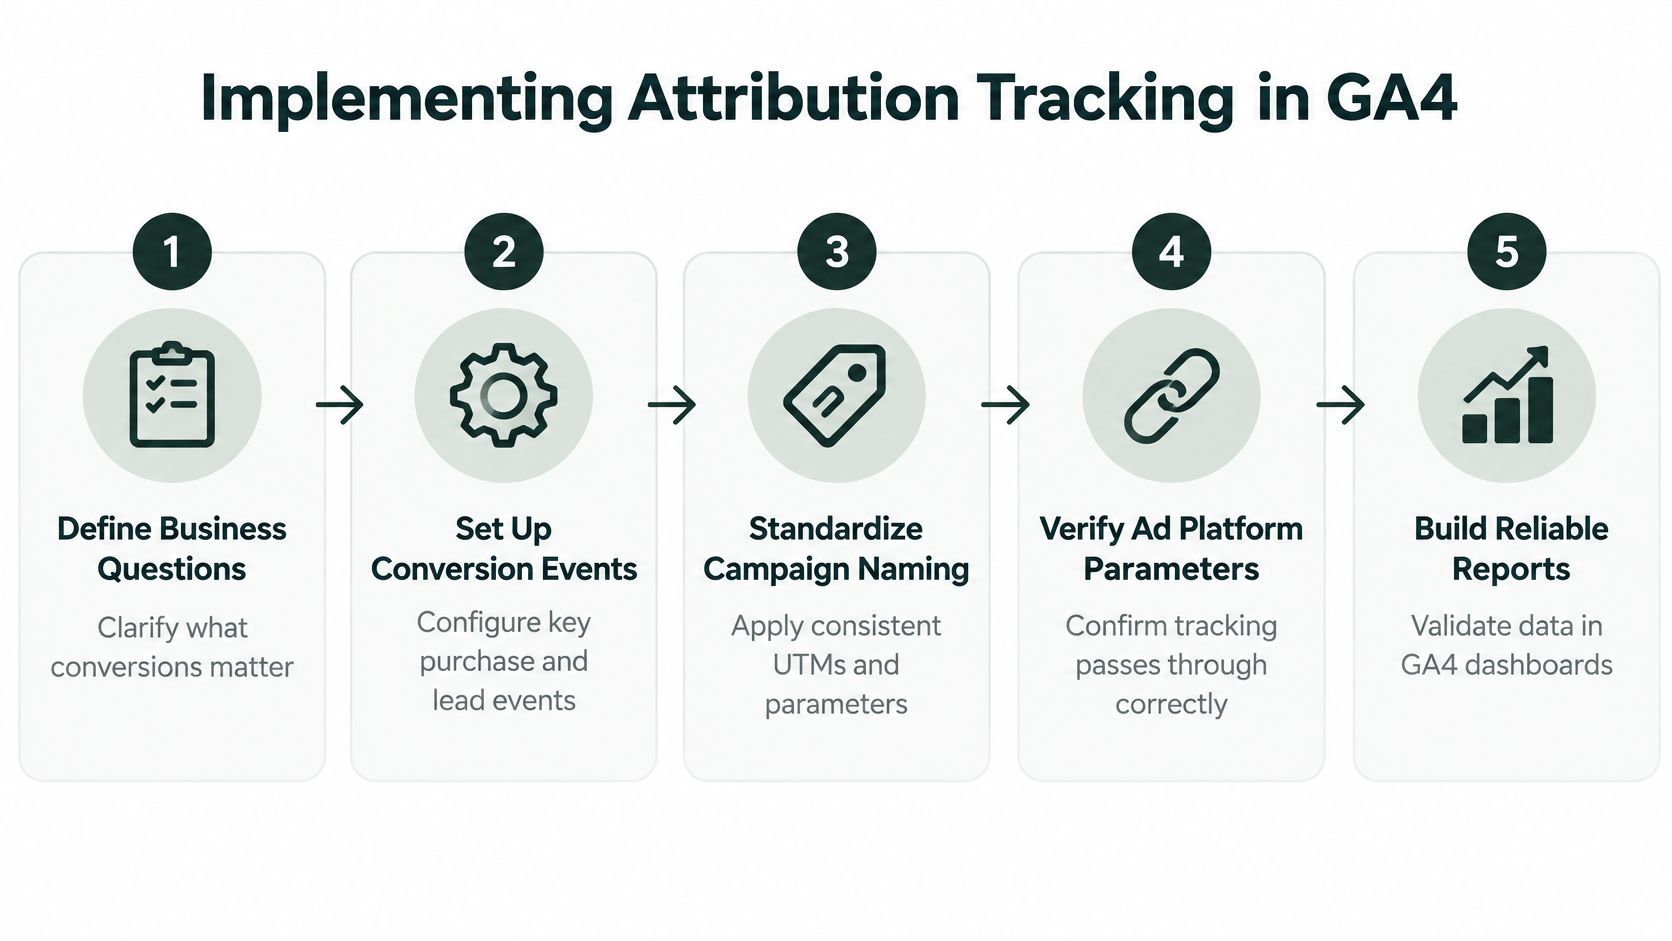
- Start with the business question: Decide which decisions this reporting must support, such as creative iteration or channel comparison, before touching settings.
- Define conversion events: Mark the purchase and key lead events that matter, and confirm each fires once per completed action.
- Standardize campaign naming: Enforce consistent UTM values for source, medium, and campaign so the same channel doesn't fragment into several labels.
- Confirm platform parameters: Verify that ad platform click identifiers and UTMs survive redirects and land intact on the page.
- Configure cross-domain measurement: Link your storefront, presell pages, and checkout domains so one journey doesn't split into disconnected sessions.
- Validate in reporting: Reconcile GA4 purchase counts against your commerce platform before trusting any attribution view.
Quality Checks That Catch Silent Failures
Most attribution errors don't announce themselves. They show up as a mysterious rise in direct traffic or a channel that suddenly looks worthless. Run these checks regularly.
- Duplicate events: Test a real purchase and confirm the event records once, with correct value and currency
- Missing parameters: Sample recent sessions and confirm UTMs aren't stripped by redirects or link shorteners
- Consent outcomes: Document how consent mode affects your observed paths so signal loss is known, not guessed at
- Domain boundaries: Click through from ad to presell page to checkout and confirm the session stays intact
Finish with a decision audit. Open your attribution settings and ask whether the configured model matches the question your team asks in weekly meetings. If media buyers optimize on last-click reports while leadership discusses full-funnel contribution, you don't have a tooling problem. You have a mismatch between the model and the decision, and no setting change alone will fix it.
Attribution Examples for Paid Social Journeys
Models become concrete when you run the same journey through two of them and watch the story reverse. These scenarios are illustrative. Their value is showing how interpretation changes, not claiming any particular performance result.
A Cold Paid Social Journey
A shopper clicks a TikTok ad, lands on an advertorial, reads it on her phone, and leaves. Two days later she types your store URL directly to check reviews. That evening she searches your brand name, clicks the result, and buys.
Under first click, paid social receives all the credit and looks like your growth engine. Under last click, branded search receives everything and paid social looks wasteful. Neither report is lying about the path. They're applying opposite assumptions about which moment mattered, and a budget decision built on either one alone will mislead you in opposite directions.
An Email Assisted Repeat Purchase
Now consider an existing customer who sees a creator mention your product in a social post that carries no tracking, opens your email the next day, clicks through, and buys again. Your report shows a clean, short path credited largely to email. The untracked creator exposure that may have prompted the open never appears.
A tidy report often means your tracking captured a short path, not that the customer's decision was actually simple.
Data hygiene shapes these examples as much as model choice does. Low quality or fraudulent sessions can inflate early touchpoints and distort which channels appear to start journeys. The guidance in Securify on filtering fake visitors is relevant here because cleaning invalid traffic protects the path data your models depend on.
Train your team to read every attributed result with three questions. Which interactions were directly observed? Which credit rule was applied to them? Which customers and exposures stayed invisible? A presell page that looks weak under last click may be doing early persuasion work. An email that looks decisive may be harvesting intent created elsewhere. Attribution modeling gives you the path. Judgment tells you what the path leaves out.
Testing Incremental Lift With Controlled Experiments
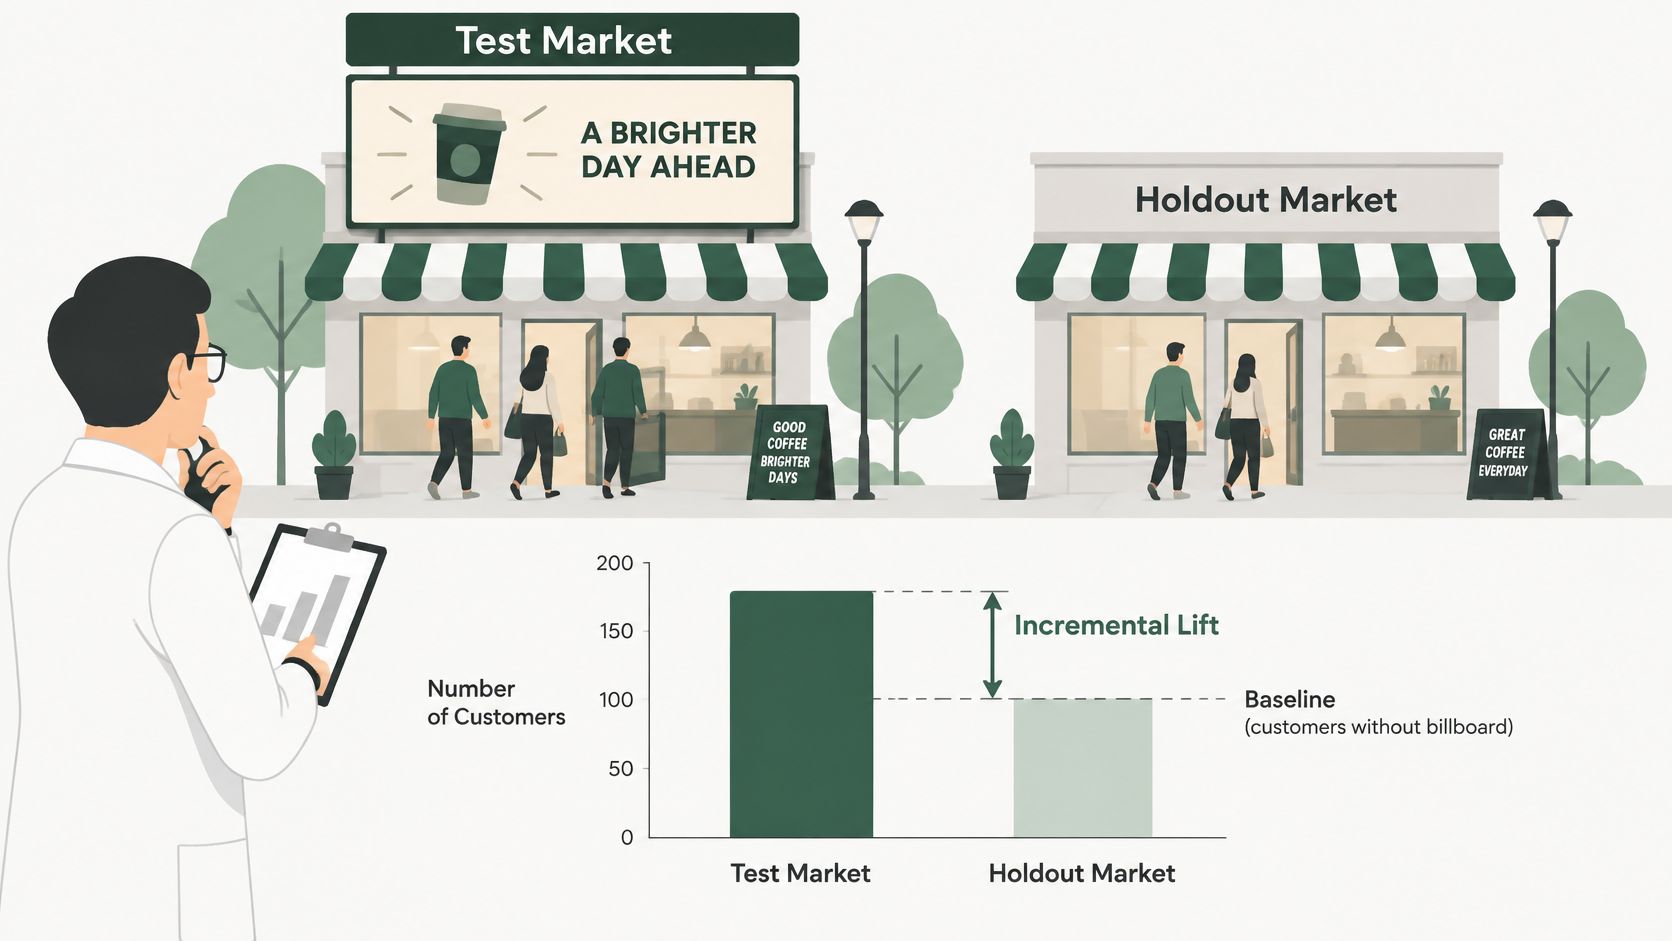
Attribution tells you who was present before a purchase. Experiments tell you what would've happened without the intervention. That counterfactual is the difference between reporting and evidence.
The distinction is worth stating plainly because it's the most common error in DTC measurement. Google draws the line directly in its guidance separating attribution from incrementality measurement, where attribution associates conversions with touchpoints while incrementality isolates conversions causally driven by marketing. Adoption reflects that urgency, with 52% of U.S. brand and agency marketers using incrementality testing in 2025 and another 36% planning to increase investment over the following year.
Choosing a Test Design
- Randomized holdouts: Withhold an ad, audience, or page variant from a randomly chosen group, then compare total purchases between groups. Best for landing page and campaign questions where you control exposure.
- Geo experiments: Run the treatment in some regions and hold it out in comparable ones. Best when user-level randomization isn't feasible.
- Matched markets: Pair similar regions and treat one of each pair. A practical fallback when clean randomization is limited.
For page-level questions, pair this logic with disciplined variant testing. Our A/B testing guide for DTC brands covers the mechanics, and for broader context on combining these methods, the overview of marketing attribution with SourceLoop is a helpful reference.
The following video walks through how controlled lift studies are structured in practice.
Interpret results in a fixed order. Define the outcome as total incremental purchases, not platform-attributed conversions. Choose your unit, whether user or region, and protect the test from contamination. Estimate uncertainty rather than reporting a single lift number. Watch for classic errors, including retargeting your holdout group, changing the treatment mid-test, or claiming causality from a simple before-and-after comparison where seasonality could explain the change.
Building a Complete Measurement Stack
User-level attribution and marketing mix modeling aren't rivals. They operate at different altitudes, and treating them as substitutes is why teams end up with fast reports they can't trust for budget decisions, or rigorous models that can't guide daily optimization.
Attribution gives granular, fast feedback for creative, audience, and landing page iteration. Its weakness is dependence on identifiable event paths. It misses offline exposure, cross-device behavior, and privacy-restricted signals. MMM works on aggregated data and can estimate channel-level impact without individual identifiers, covering channels from TV and out-of-home to search and social. Its weakness is speed and granularity, plus sensitivity to model assumptions.
The industry is moving toward combining these layers rather than choosing between them. Google's open-source Meridian, launched broadly in January 2025, reflects that hybrid direction, since its Bayesian MMM can incorporate incrementality experiments as priors, a design described in Google's announcement of Meridian for marketing mix modeling.
Matching Each Layer to a Decision
- Attribution for iteration: Daily and weekly diagnostics on campaigns, audiences, and pages
- Experiments for validation: Periodic causal checks on the channels and pages you're about to scale
- MMM for allocation: Portfolio-level budget decisions across online and offline channels
When you're setting up this stack, anchor each layer to metrics that fit its altitude. Our breakdown of which KPIs matter by funnel stage helps keep fast diagnostic metrics from being mistaken for portfolio evidence.
The useful question isn't which measurement method is best. It's what decision each method should support, and how much evidence that decision deserves.
A minimum viable stack for most DTC teams is simpler than vendors suggest. Run clean GA4 attribution for operational reporting. Add a recurring holdout or geo test for your largest spend drivers and your highest-traffic presell pages. Consider MMM only when your channel mix and spend level make portfolio allocation a genuinely hard problem, especially once offline or broad-reach channels enter the mix. Sophistication should follow decision value, not fashion.
Recommended Attribution Decisions for DTC Teams
You don't need a perfect model. You need a defensible one, matched to clear decisions, with causal checks where money is on the line. Use the framework below as your operating standard.
Decision Framework
- Directional reporting: Use one transparent model consistently so week-to-week comparisons mean something. Consistency beats sophistication when the goal is spotting change.
- Platform optimization: Use data-driven attribution where your data quality and volume support it, while documenting that you're accepting less transparency for more adaptation.
- Scaling claims: Require a controlled experiment before you claim a channel or page reduced acquisition costs. Platform-reported wins don't meet that bar.
- Portfolio budgeting: Bring in MMM when allocation across many channels, including offline, justifies the investment in aggregated modeling.
Privacy constraints should shape these choices directly. Minimize your dependence on complete user-level paths, document where signal is lost, and use consented first-party data responsibly. When individual paths are thin, triangulate with aggregated and experimental evidence instead of pretending the remaining tracked journeys represent everyone.
For tools, Landra fits the page-testing layer of this stack. It generates advertorial and listicle presell pages for DTC brands and supports rapid variant creation, which matters because testing page variants quickly is only useful if your measurement can tell real lift from reallocated credit. When you evaluate those variants financially, our practical marketing ROI guide helps connect page results to business outcomes.
A Short Checklist Before You Trust a Result
- Question match: Does the model fit the decision, or are you using path data to make a causal claim?
- Data integrity: Are events deduplicated, parameters intact, and domains stitched?
- Visibility gaps: Have you named what's unobserved instead of treating tracked paths as complete?
- Causal evidence: For any scaling decision, do you have a holdout or geo test, or only attributed conversions?
- Presell page discipline: When a new advertorial variant appears to win, did you test whether it increased total incremental purchases, or did it pull credit forward from the product page?
That last item deserves emphasis for paid social teams. Rapid variant testing is valuable, and it's also the easiest place to fool yourself, because a page can improve its own attributed conversion rate while total purchases stay flat. Pair fast page iteration with a holdout whenever you're claiming genuine CAC improvement. Attribution modeling will keep your reporting honest about paths. Experiments will keep your growth claims honest about cause.
If you're testing presell pages against cold Meta or TikTok traffic, you need variants fast enough to keep up with your measurement cadence. Landra turns a product URL into an editable, mobile-first advertorial or listicle in minutes, so you can publish to Shopify or export HTML and run your next controlled test this week instead of waiting on a design queue.