
Most guides to PPC for ecommerce hand you the same instruction: sort campaigns by ROAS, scale the winners, cut the losers. It sounds like discipline. It's a reporting habit wearing a strategy's clothes.
Return on ad spend divides tracked revenue by ad spend. It never asks what the order cost to fulfill, how much came back as a refund, or whether the buyer would have purchased anyway. A campaign sitting at 6x can lose money on every order. A campaign at 1.8x can be the best thing in the account if it brings in high-margin customers who come back.
So the popular advice isn't wrong so much as unfinished. What's missing is a number: the most you can pay to acquire an order before the order stops being profitable. Every decision below hangs off that number, and every decision gets judged against it instead of against the platform's dashboard.
Table of Contents
- What Ecommerce PPC Actually Buys
- Where to Put Ecommerce PPC Spend
- How Feeds and Structure Make Automation Safe
- Structure Campaigns Around Intent and Audiences
- Set a Break-Even CAC Before You Scale
- Measure Purchases Automation Can Learn From
- Fix the Page the Click Lands On
- Pick One Test Before You Add Budget
What Ecommerce PPC Actually Buys
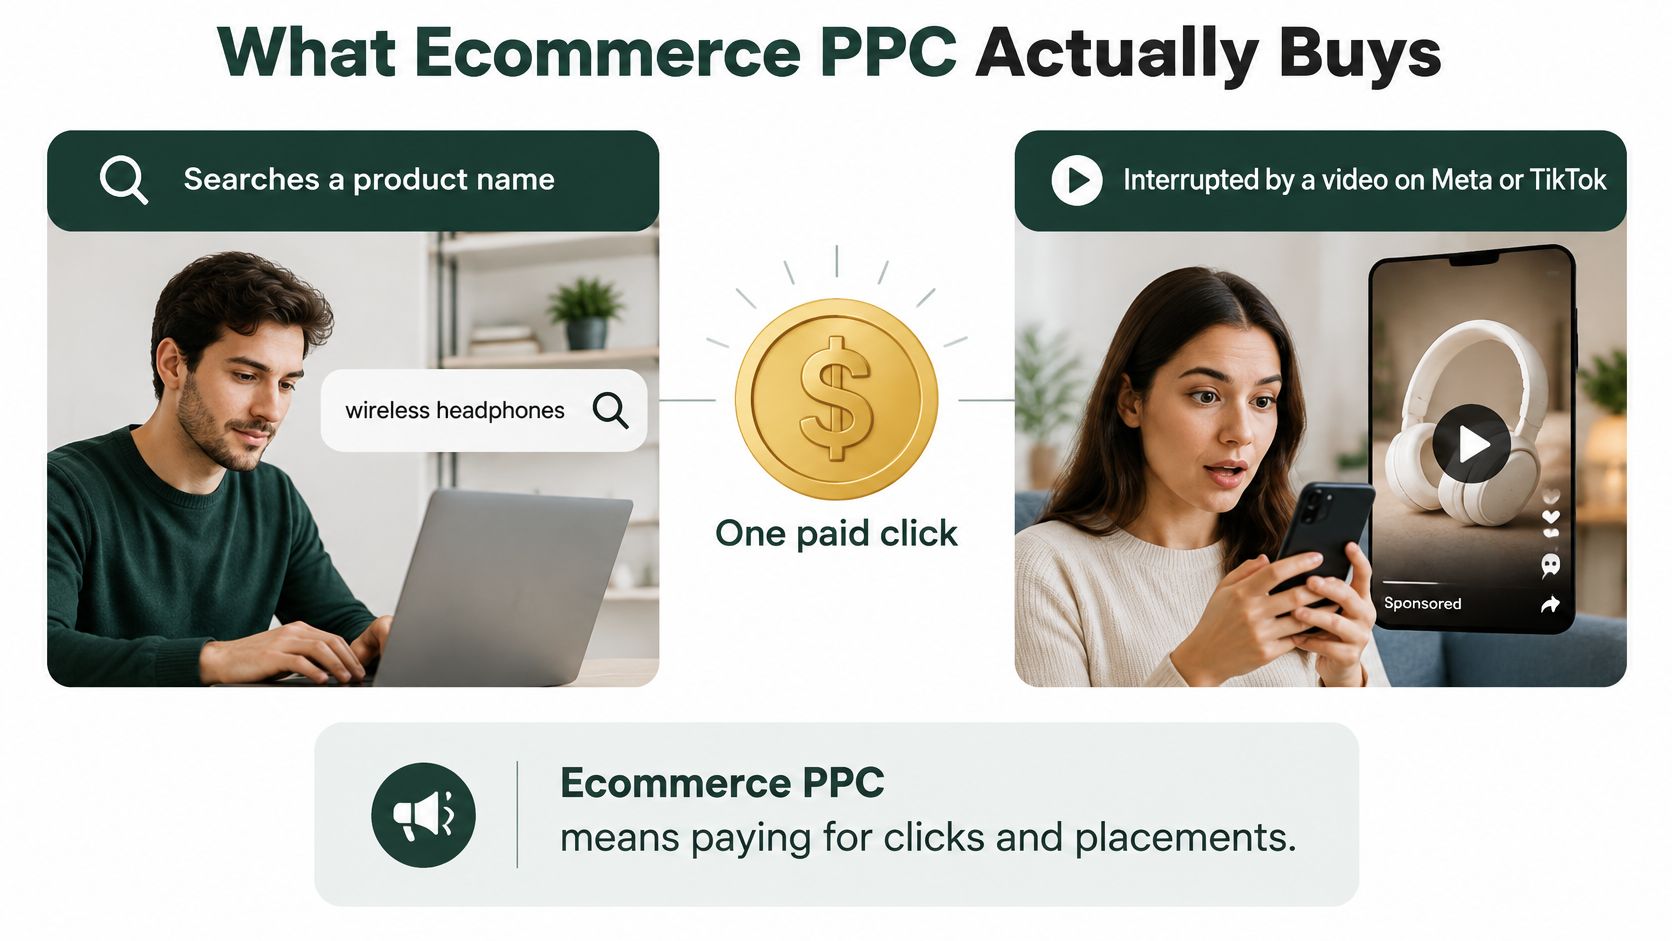
Two shoppers produce one paid click each. The first types a product name into Google and clicks a result. The second is halfway through a video and gets interrupted by an ad for something they hadn't considered. The clicks cost about the same. The intent behind them doesn't.
Ecommerce PPC means paying for clicks and placements that should turn into orders. In 2026 that covers Google Search, Shopping, Performance Max, Demand Gen, paid social and retail media, not keyword ads alone. The category is still vast: search advertising generated $102.9 billion in the U.S. in 2024, 39.8% of a record $258.6 billion digital advertising market, and grew 15.9%, while retail media reached $53.7 billion, up 23.0%, per the IAB's 2024 digital ad revenue report.
Search answers a need someone already stated. Social interrupts a stranger and asks them to care. Same click price, different psychology, different landing page, different bid.
The rule everything below runs on: a click pays only when the contribution left after product cost, shipping, discounts and returns covers the cost of acquiring that order.
Keep one hero SKU in mind as you read. Every worked example uses it: the channel that gets the next dollar, the feed fields that steer automation, the break-even number, the purchase signal the bidding system learns from, and the page the click lands on.
Where to Put Ecommerce PPC Spend
Before a single campaign setting, decide what each channel is for. Six placements absorb most ecommerce budgets, and each one fails in a predictable way.
| Channel | Demand it captures | Use it when | Main waste |
|---|---|---|---|
| Google Search | Named product or category intent | Brand and proven non-brand queries | Rising CPCs on broad terms |
| Google Shopping | Comparison-ready product intent | Feed titles, price and GTINs are accurate | Missing attributes and weak images |
| Performance Max | Automated cross-inventory reach | Purchase volume and a clean feed exist | Spend on low-margin or out-of-stock SKUs |
| Demand Gen | Visual discovery | Product feeds and creative inputs are ready | Running without a feed |
| Paid social | Interrupted, often cold attention | The page can build belief before checkout | Sending cold clicks straight to a product page |
| Retail media | Onsite marketplace intent | The product already sells in that retailer | Ad fees stacked on marketplace take rate |
Staying in search is getting more expensive. Google paid-search spending rose 11% year over year in Q3 2024 while average cost per click rose 8%, according to Tinuiti's digital ads benchmark report. Buying more of the same query costs more each quarter, so the live question isn't whether search works. It's which channel earns the next dollar.
Who should pick each row
Search fits every store with a product people search for by name or category, and it belongs in its own campaign so branded clicks don't flatter non-brand results. Shopping is the first stop for a store with clean product data, because the feed does the targeting. If your titles are thin or your GTINs are missing, fix that before you raise budgets.
Performance Max only makes sense once real purchase volume exists and the feed can carry it. Keep low-margin and volatile SKUs out of the asset groups so automation can't scale them. Demand Gen suits visual products and works best alongside a feed rather than as a replacement for one.
Paid social is the right buy when the offer needs explaining and the page can teach before it asks for a sale. Retail media belongs where the cart already exists, and you count marketplace fees and ad cost together, never the ad spend alone.
If your search program is the main engine, our paid search playbook for DTC brands covers the query-level work in more detail. And before you shift budget between channels on the strength of a reported lift, read Headline Marketing Agency's guide to incrementality in paid search. It's a useful check on whether a channel created demand or took credit for it.
Budget order: fund the demand that already exists until you know your break-even CAC, then spend on discovery.
How Feeds and Structure Make Automation Safe
Automation can spend against product data and creative inputs faster than a weekly review can catch weak information. A thin product title or inaccurate availability can send more paid clicks to a product that is hard to find, unavailable, or unprofitable. Campaign structure still matters because it determines which products and signals automation can scale.
Google's recap reports that Demand Gen campaigns using product feeds averaged a 33% conversion uplift compared with campaigns without feeds. It also reports feed adoption rising from 16% in 2024 to 35% in 2026. These figures, summarized in Google's 2025 advertising recap, point to growing use of feeds, not a guaranteed lift for every store.
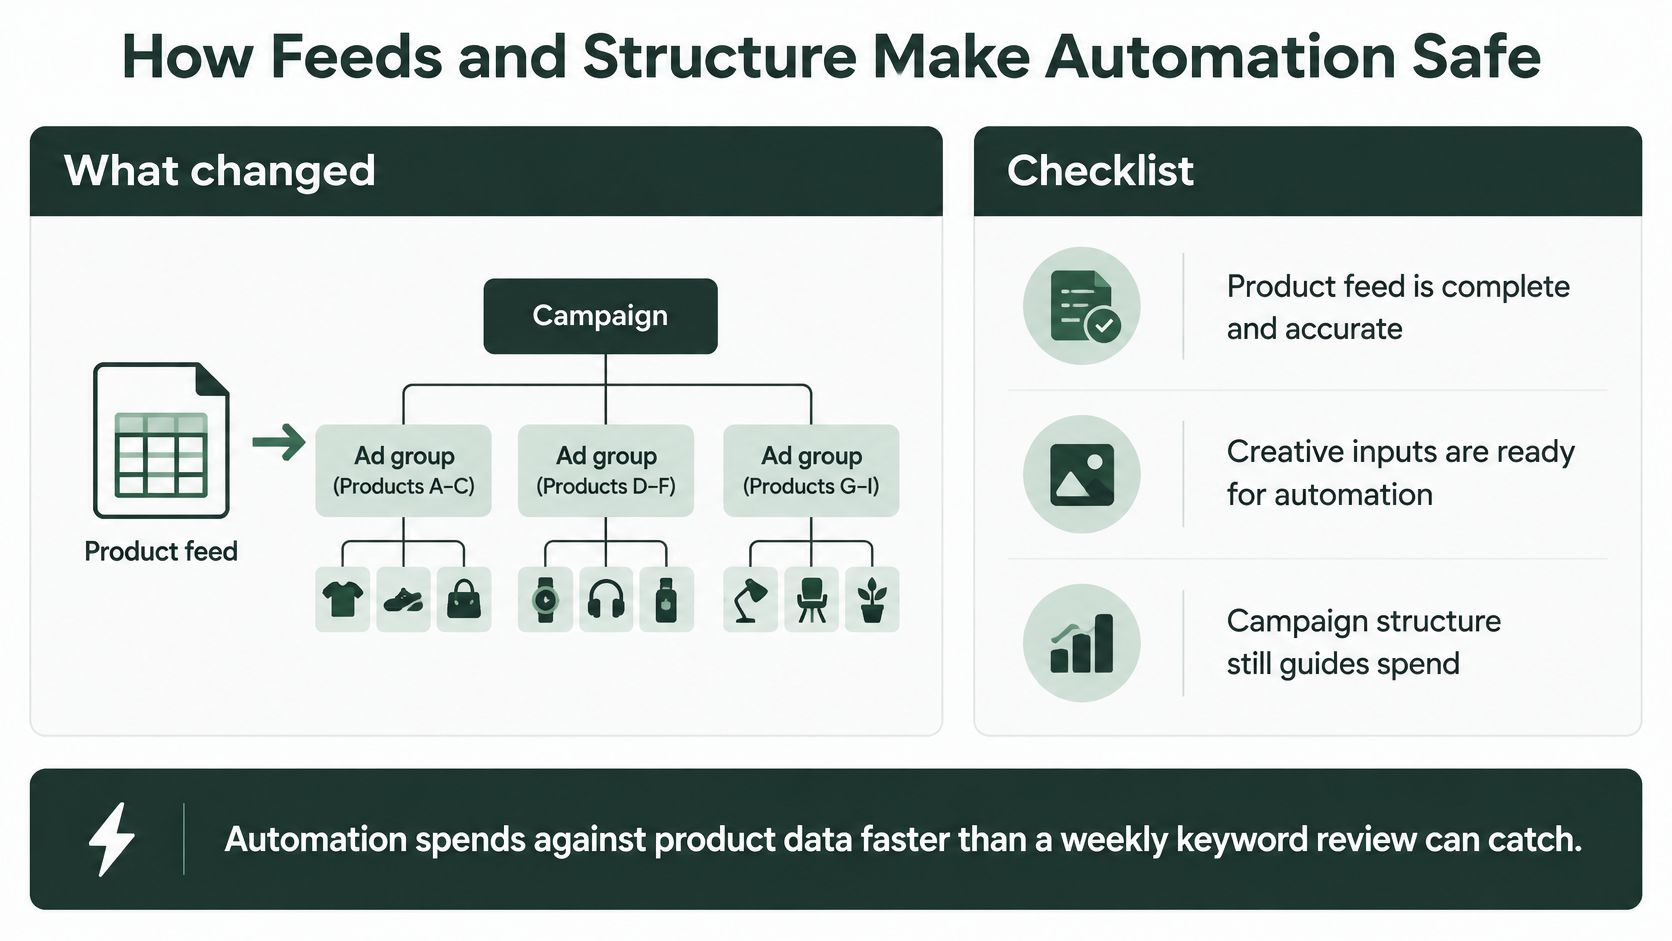
A six-step feed audit
Check these in order. Each step reduces the chance that automation directs spend toward a product or destination that cannot convert profitably.
- Fill the fields shoppers compare. Add the GTIN, title, price, availability, and primary image, along with relevant size, color, material, or compatibility details. These attributes help shoppers judge whether the product fits; missing information can cost you the click.
- Separate hero SKUs from the rest. Give hero products their own campaign and budget. Keep low-margin, high-return, or volatile inventory in a separate group with tighter targets, so its performance does not get hidden inside a stronger blended result.
- Check stockouts and disapprovals daily. An ad for an unavailable product can spend against demand you cannot fulfill. A disapproval left unnoticed also prevents eligible impressions from serving.
- Match the landing URL to the advertised variant. If the ad shows a 500ml amber bottle, send the click to that bottle, not a category page where shoppers must search again.
- Keep claims within what the product page supports. Health outcomes, before-and-after framing, and guaranteed results can create a mismatch if the page does not substantiate them. That mismatch risks both policy problems and wasted clicks.
- Test the destination, not only the feed. For cold traffic, compare a product page with an editorial pre-sell page using the same offer and price. Judge the result by cost per acquisition, because a high last-click ROAS can still conceal an acquisition cost above your break-even point.
Automation can expand discovery, but the feed and campaign structure set its boundaries. If the inputs are weak, more reach can mean more spend on products shoppers cannot confidently buy.
Structure Campaigns Around Intent and Audiences
Account layout exists to stop one kind of demand from hiding another. Branded clicks look cheap and convert well, and if they sit in the same campaign as cold non-brand terms, the blended number flatters both. Separate them before you judge anything.
- One brand campaign. Exact and phrase match on your own name and common misspellings. Its job is defense, and it should never be the evidence that non-brand works.
- One non-brand Search campaign per product theme. Tight themes, not a single catch-all. Exact and phrase match for terms that have already converted; broad match only alongside smart bidding and a mature negative list.
- One Shopping campaign per hero-SKU group. Product-group level bidding so the hero product has its own budget instead of sharing a pooled target with slow movers.
The negative-keyword routine
Once a week, open the search terms report and read what triggered your ads. Add non-buying intent to a shared exclusion list: jobs, salary, free, DIY, reviews, repair, recall, and any competitor service query that never converts. Push those exclusions to every campaign, including Performance Max and Demand Gen, because those surfaces read the account-level list too.
Audience signals are a hint, not a fence. Performance Max and Demand Gen will go where the conversions are, so each asset group should mirror the product group it sells and carry creative that matches those products.
Bid targets come from the worksheet, not a round number
Set your target from the break-even figure you calculate next, not from a habit like 400% or 500%. Pick a target ROAS whose implied cost per acquisition sits under break-even with a margin for error. Then give the hero campaign a budget floor so it never starves, and cap the discovery test so one experiment can't consume the account in a bad week.
Copy this into your build doc: one brand campaign, one non-brand Search campaign per product theme, one Shopping campaign per hero-SKU group.
Set a Break-Even CAC Before You Scale
Here is where most accounts break. The team scales whatever the platform reports as strong ROAS, and nobody checks what the order left behind. Build the number first, then let it overrule the dashboard.
| Input | Example | Effect on CAC |
|---|---|---|
| Price | $80 | Starting revenue |
| Product cost | $28 | Subtract |
| Shipping and payment fees | $8 | Subtract |
| Average discount | $6 | Subtract |
| Expected return cost at 12% | $9.60 | Subtract |
| Contribution before ads | $28.40 | Break-even first-order CAC |
Every figure above is an example. Replace each one with your own before you scale anything. Subtract in the order the money leaves: product cost first, then shipping and payment fees, then the average discount you give rather than the list price, then the expected cost of returns.
The result is $28.40 of contribution, so a first order has to be acquired for less than $28 to make money. That's the ceiling. Not 4x. Not whatever the platform's recommended target suggests.
Where the inputs come from
Pull refund rate and repeat timing from Shopify or your finance records, not from the ad platform. Shopify notes that multichannel shopping makes attribution difficult, since a customer can start in Shopping, leave, and come back through email while Google credits only the last measurable touchpoint, as described in Shopify's ecommerce PPC guidance. Your order data doesn't have that blind spot.
Discount depth is the input teams most often fudge. A guide to why fragrance shoppers expect online discounts makes the point neatly: a permanent promotion becomes the actual price, and that's exactly how it behaves in this worksheet.
The contrarian version: a lower reported ROAS can be better growth when it buys incremental, high-margin customers. A high ROAS can just be harvesting people who were going to buy anyway.
For a product with a strong 90-day reorder, you may accept a first order slightly above break-even, but only up to the contribution those repeats add. Not up to what you hope they'll add. If profit per order is negative after all of this, pause or cap the campaign even when ROAS looks healthy. Our guide on how to reduce customer acquisition cost for Shopify goes deeper on where those savings usually sit.
Measure Purchases Automation Can Learn From
Google Ads bids toward the conversions it can see. That single sentence explains most mysterious performance. If your purchase signal is broken, incomplete or attached to the wrong event, the system optimizes toward the wrong people and reports the result with total confidence.
Google describes Enhanced Conversions as a feature built to improve conversion-measurement accuracy and enable stronger bidding, and it works by supplementing your standard conversion with first-party data captured at the point of purchase, hashed with SHA-256 before transmission, as documented in Google's Enhanced Conversions support guide. The hashed identifiers let Google match a purchaser to accounts that saw an ad, recovering sales that cookies and cross-device gaps lose.
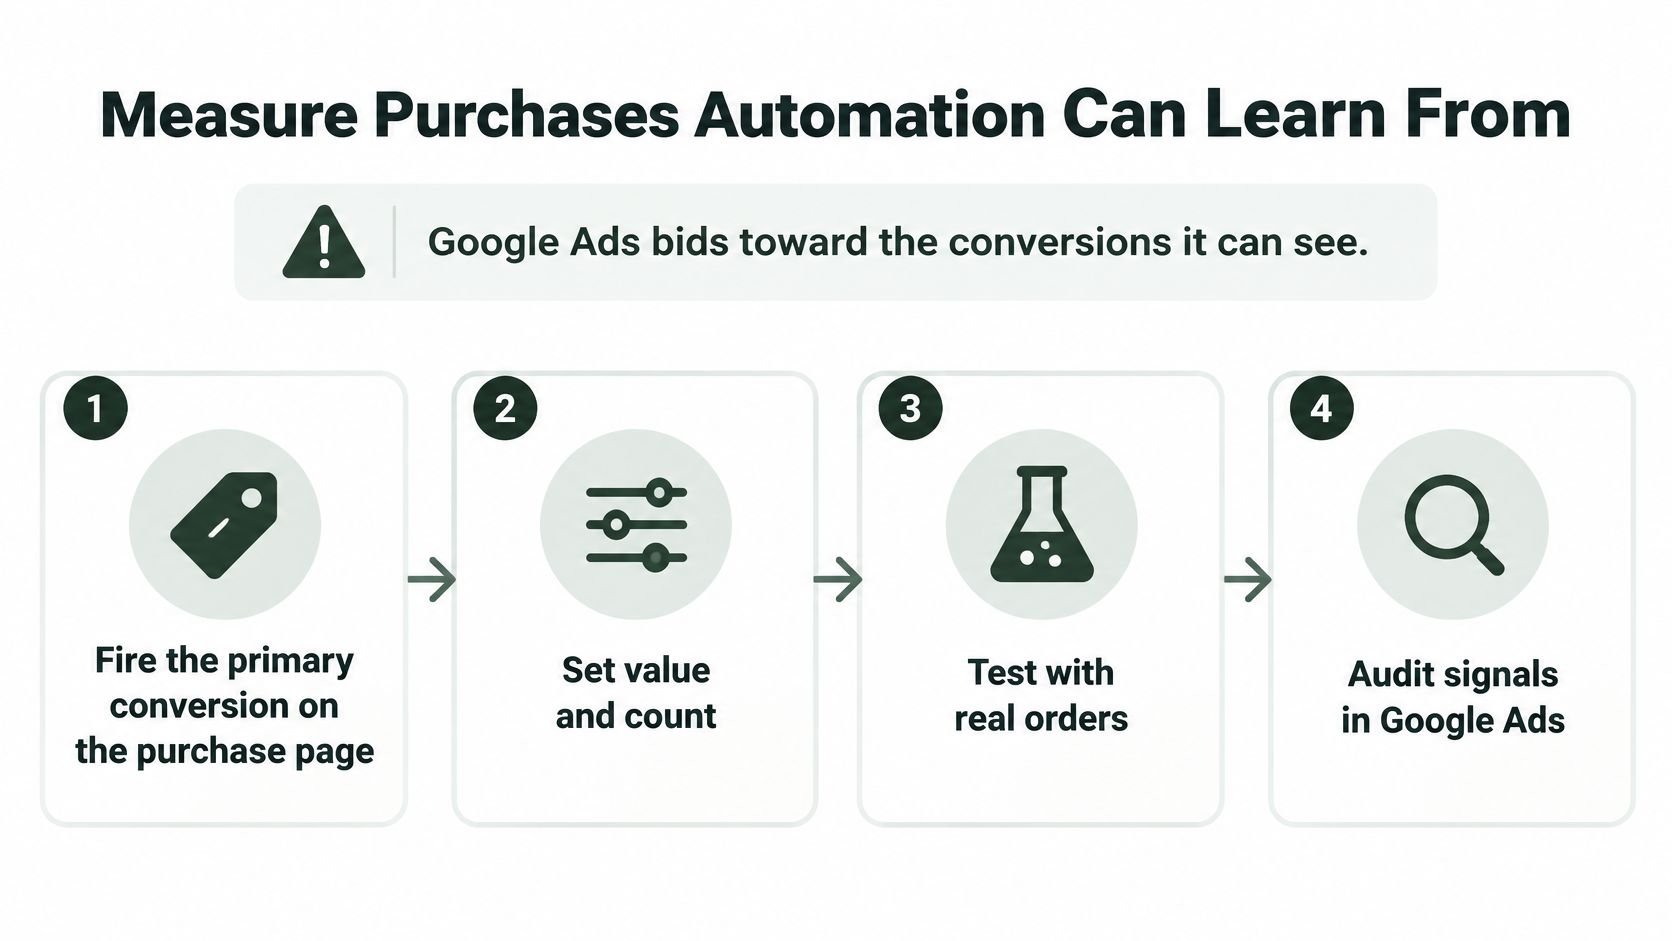
Six actions, in order
- Fire the primary conversion on the store confirmation page. Pass value, currency and transaction ID. Never count a pre-sell view or an outbound click to the product as the revenue conversion.
- Add Enhanced Conversions with consent. Collect email, name, phone or address only where the shopper has given the required consent, and follow Google's customer-data policies on what you send.
- Keep softer events secondary. Add-to-cart and email signup are useful diagnostics, not bid goals. Promote them and the algorithm will find you cheap add-to-carts.
- Reconcile against Shopify for the same dates. Count platform conversions next to actual orders and separate modeled from measured. The gap is your measurement debt.
- Test instead of arguing when ROAS and profit disagree. A geo split or conversion-lift test on two similar regions with the same ads settles it. Lift testing is now available at lower spend and conversion thresholds, but a small brand can start with two regions and identical creative.
- Read the winner as incremental profit per order against the break-even CAC, then move budget only after that comparison, not before.
Once the signals are clean, keep your own audit routine. Three reports, checked weekly, catch nearly everything.
Watch purchase match rate to catch signal loss early, profit per order to catch a campaign that reports well and pays badly, and device-level drop-off to see where the session dies. Each one answers a different question, and none of them lives on the platform's home screen by default.
Fix the Page the Click Lands On
Checkout friction is a media problem wearing a UX costume. The advertiser pays for a session, the shopper abandons, and nobody books the loss against the campaign. Baymard's benchmark of leading US and European ecommerce sites found 59% of desktop sites and 59% of mobile sites with checkout UX rated mediocre or worse, and only 1% of mobile sites rated good, alongside an average of 39 potential checkout-improvement areas per site, according to Baymard's checkout research.
Baymard estimates that solving documented checkout usability problems could lift conversion rate by 35.26% for an average large ecommerce site. Treat that as an average and an estimate, not a promise for your store.
Run it against a real campaign anyway. 10,000 paid sessions at a 2.0% purchase rate is 200 orders. A 35.26% relative improvement takes the rate to roughly 2.71%, or about 271 orders, for roughly 71 additional orders with no change in CPC, creative or budget.
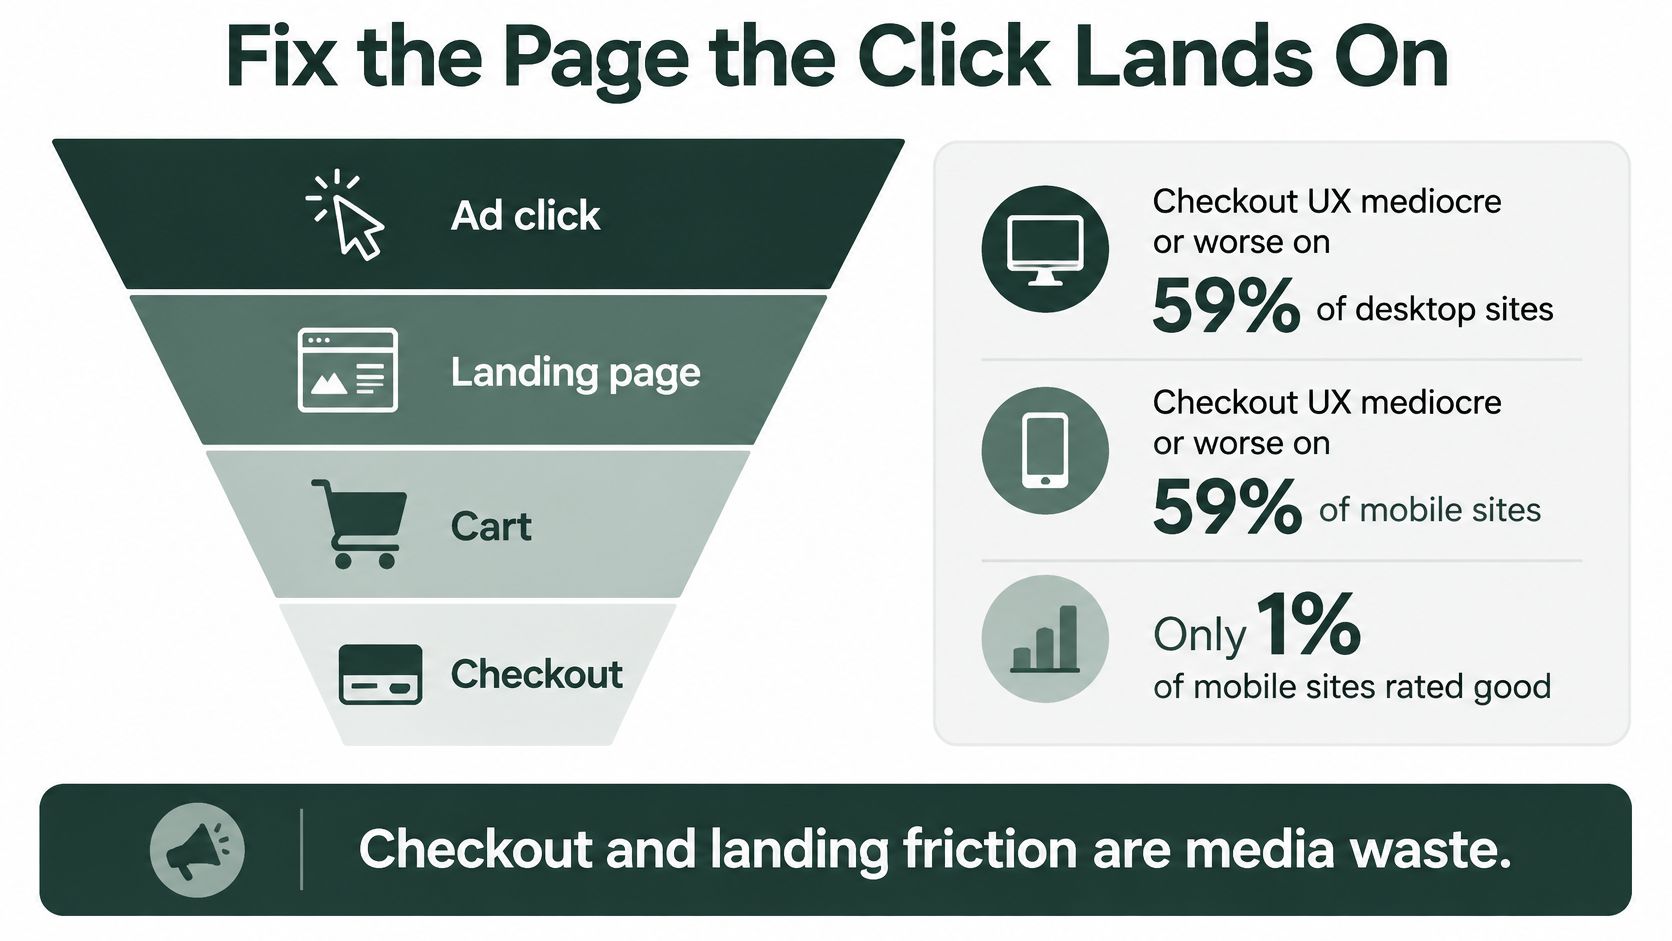
Where the loss actually happens
Split the loss before you fix it. Break results down by device and by stage: landing page to add-to-cart, add-to-cart to checkout start, checkout start to purchase. If mobile loses twice the traffic of desktop at the payment step, you have a form problem. If the drop is at add-to-cart on cold social and at payment on search, you have two different problems and one page won't solve both.
For high-intent Search and Shopping traffic, send the click to the exact product or variant it promised. Remove unnecessary fields, show shipping cost before the payment step, and let people check out as guests. For cold Meta or TikTok traffic, the product page is a closing argument delivered to someone who just walked in. Handle the objection first, then keep checkout short.
Practical rule: never count an advertorial view or an outbound click as the purchase. If it isn't the confirmation page, it isn't revenue.
Segment your landing-page variants so a weak page doesn't get blamed on the ad. Our guide to A/B testing pre-sell pages covers how to structure those variants so the comparison holds up.
Pick One Test Before You Add Budget
Choose a single change and run it against the break-even CAC from your worksheet. Not a rebuild, not a new agency, not another channel.
If Search or Shopping carries the spend and the feed is messy, the test is feed cleanup on the hero SKU, following the audit sequence above. If platform ROAS looks strong but contribution after returns is thin, the test is a profit-per-order report and a pause on the weakest SKU. If cold social traffic stalls on the product page, the test is a pre-sell page against the same product at the same price, with the purchase tracked on the Shopify confirmation page.
Landra is one way to build that page. You paste a product URL, optionally add an audience and angle for more control, and generate an advertorial or listicle tuned for cold Meta and TikTok traffic. A single first-party result, in which our founder sent the same ads to a Landra advertorial instead of the product page and cut acquisition cost by 46%, is one result rather than a benchmark. Skip the page project entirely if you have no paid traffic yet or you're shopping for a full-store conversion program.
Keep the ads, the offer and the test setup unchanged. Publish the variant and judge it on incremental cost per acquisition against the number you calculated, not against the ROAS the platform prints.
If rising CPCs are making every click feel more expensive, the page after the click is where you get the money back. Landra turns a product URL into an editable, mobile-first advertorial or listicle that sits between your paid traffic and your storefront, so cold clicks meet an argument instead of a product grid. Start with one hero SKU and one variant at Landra, then judge it against your break-even CAC.