
Conversion rate is the share of sessions or clicks that complete one desired action, calculated as conversions divided by that denominator, multiplied by 100. The number only means something once you lock the denominator and define the conversion event.
That sounds simple, and the formula is simple. The difficult part is deciding what the percentage represents. A purchase rate based on sessions answers a different question from a purchase rate based on ad clicks or unique users. If you change the denominator halfway through an experiment, the dashboard can show a winner that doesn't exist.
For DTC brands, this measurement problem usually appears before a design problem. A product page may be perfectly capable of converting qualified shoppers, yet perform poorly when cold social traffic arrives without context. A pre-sell page can help by matching the visitor's awareness stage before the product page asks for the purchase.
Table of Contents
- The One Thing Most Guides Get Wrong About Conversion Rate
- How to Calculate Conversion Rate With Real Numbers
- Which Denominator You Pick Changes Everything
- Benchmarks That Actually Mean Something by Channel and Temperature
- Why Your Conversion Rate Looks Low Before Anything Is Broken
- Where Pre-Sell Pages Fit and When They Backfire
- A Short Optimization Plan You Can Run This Week
The One Thing Most Guides Get Wrong About Conversion Rate
Most guides treat conversion rate as if every store has one score that can be compared with every other store. That framing is wrong. Conversion rate is a ratio created by a measurement choice, not a permanent property of a website.
The standard definition is conversions divided by the selected audience, visitors, sessions, or clicks, multiplied by 100. Amazon's conversion rate guide makes the denominator issue clear by defining CVR against total audience, while analytics guidance from Nielsen Norman Group on conversion rates distinguishes between users and visits. Those choices can produce different results from the same buyer journey.
That creates a common DTC trap. A marketer sees a low session conversion rate on a product detail page and assumes the page needs a new hero image, a different button, or more reviews. The underlying issue may be that the report includes broad cold traffic, while the comparison page receives returning visitors from email. Many “low conversion rate” complaints are denominator or audience mismatches dressed up as design problems.
Practical rule: Never ask whether a conversion rate is good before asking, “Good against which denominator, audience, device, and conversion event?”
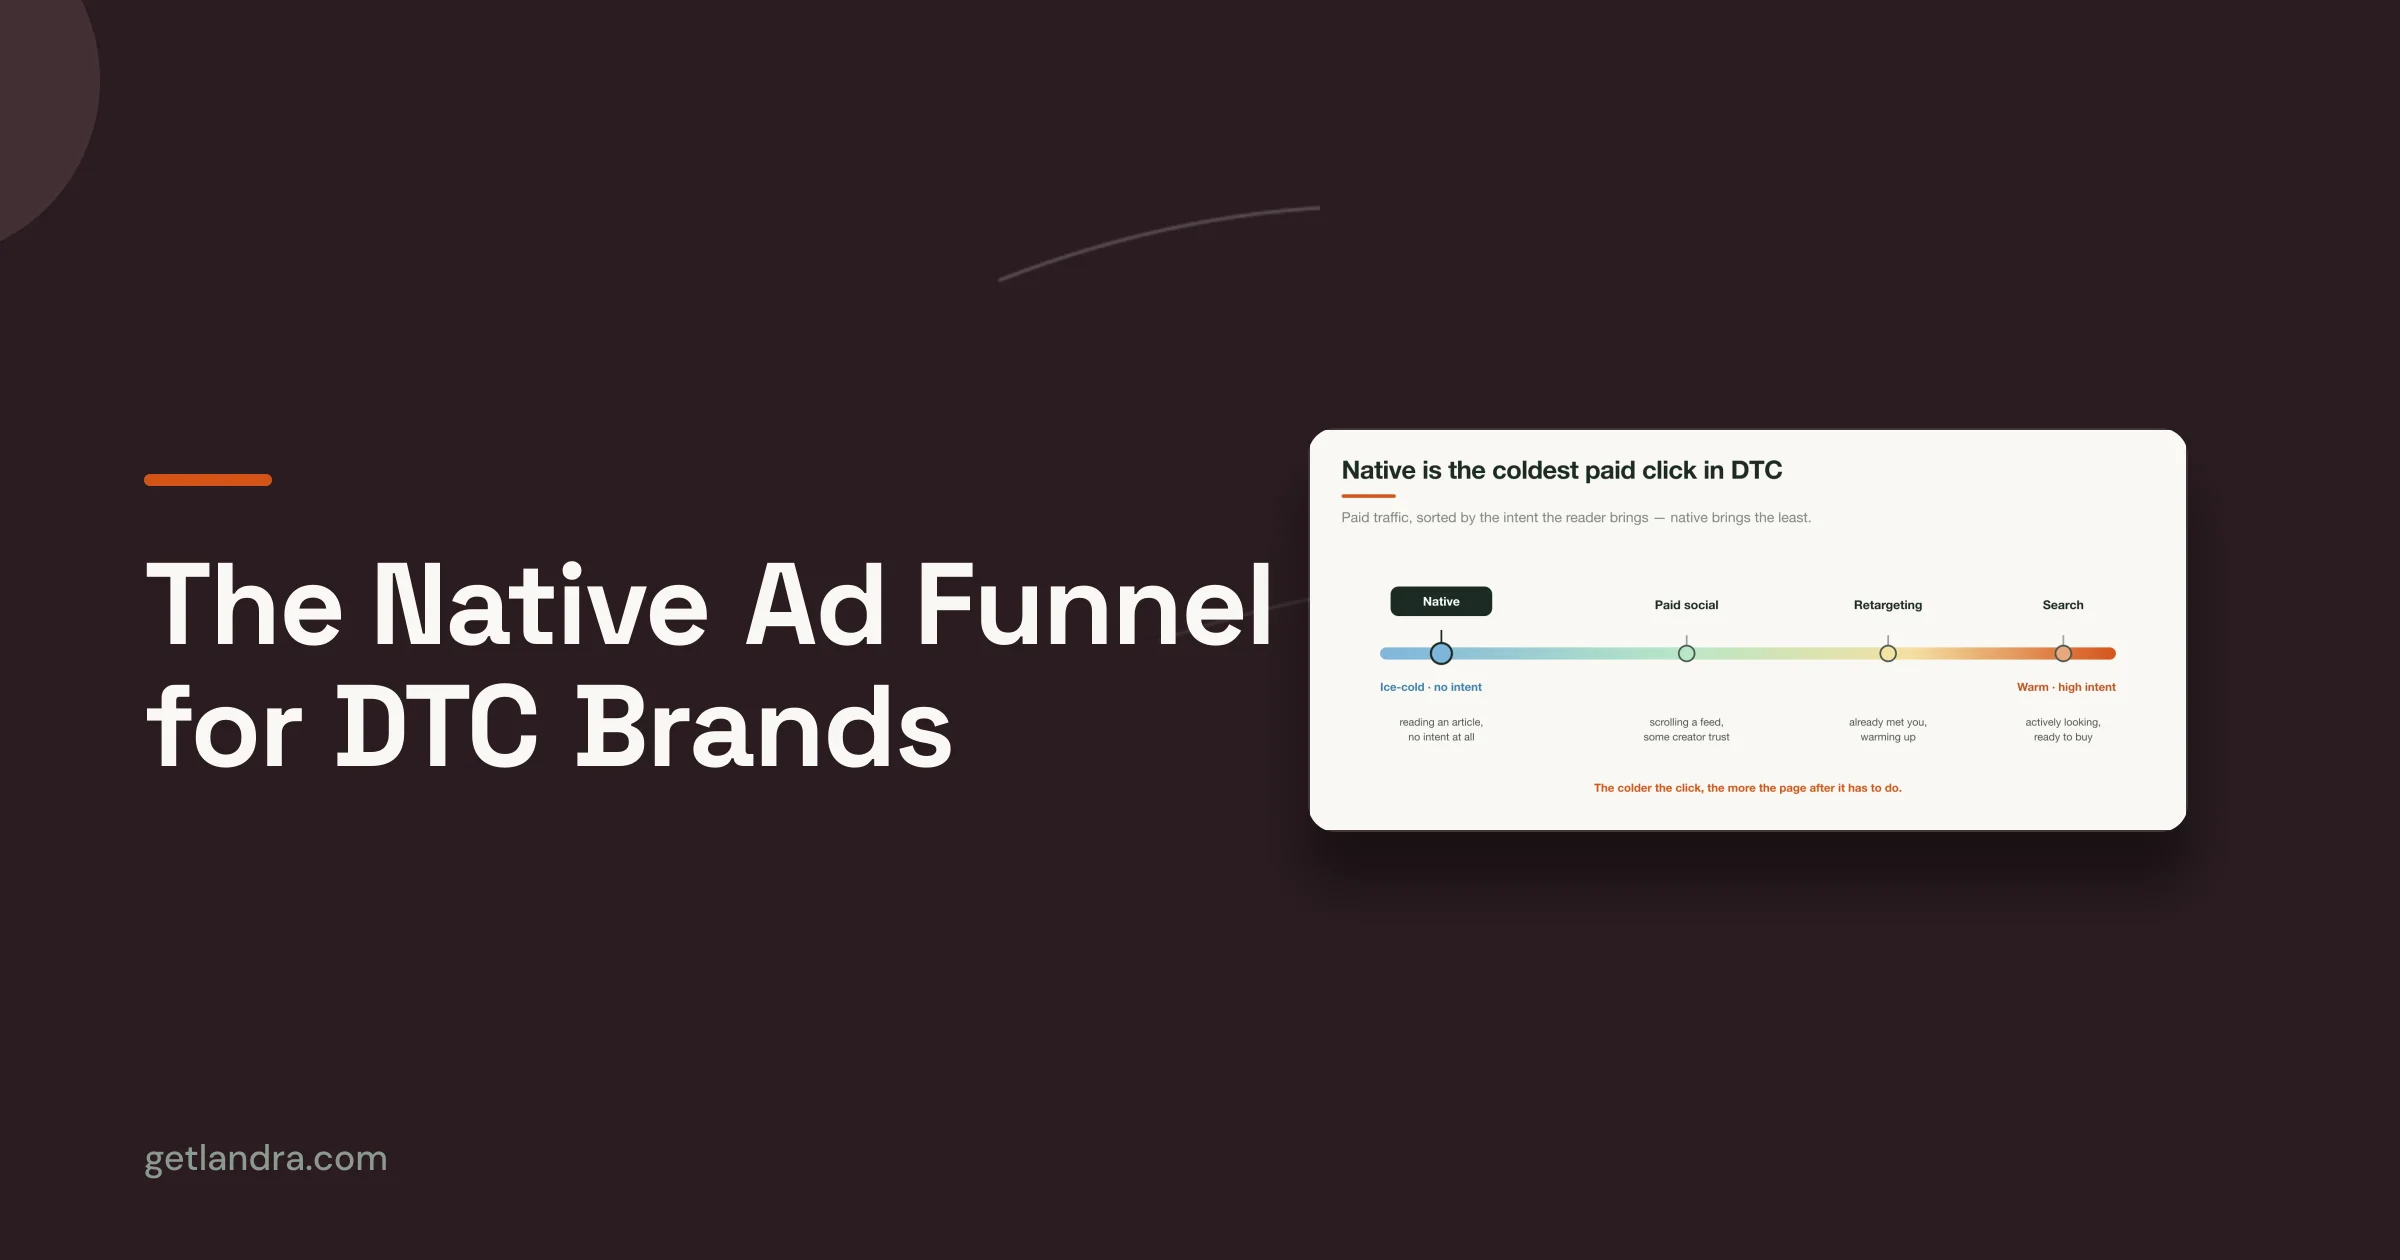
A cold paid-social visitor and a branded-search visitor don't arrive with the same level of intent. The first may need a problem explained, objections answered, and an offer framed. The second may already know the product and want shipping details or a checkout path. Sending both to the same product page can make the page look inconsistent when the actual mismatch is between traffic temperature and page format.
That's why pre-sell pages often help cold DTC campaigns before traditional CRO begins. They create a controlled step between the ad and the product detail page, with room for context, proof, and one clear next action. The measurement still has to be disciplined. Otherwise, a page can appear to win because it receives a different audience or uses a more generous attribution view.
How to Calculate Conversion Rate With Real Numbers
The formula is:
Conversion rate = conversions ÷ chosen denominator × 100
The denominator must match the question. For an online store, sessions and completed orders are a sensible starting point. For an ad landing page, clicks and completed purchases may be useful if the test is explicitly about post-click performance. For email, recipients, clicks, or unique purchasers can each answer different questions, but they shouldn't be mixed under one label.
The conversion event must also be explicit. A purchase is not an add-to-cart. A completed form is not a form start. A checkout view is not an order. If two reports use different events, their percentages aren't directly comparable even when the page and date range are identical.
Use this framework before looking at any benchmark:
| Scenario | Denominator | Conversions | Rate |
|---|---|---|---|
| Store performance | Sessions | Completed orders | Orders ÷ sessions × 100 |
| Paid landing page | Ad clicks | Completed purchases | Purchases ÷ clicks × 100 |
| Email campaign | Recipients, clicks, or unique purchasers, selected in advance | Completed purchases | Purchases ÷ selected denominator × 100 |
For store reporting, session-based conversion is usually the cleanest operating metric because it connects visits to orders. Recent ecommerce benchmark coverage places published store averages in a broad 1.4% to 2.7% cluster, with variation caused by industry mix, traffic source, sample size, and conversion definitions, as documented in this 2026 ecommerce conversion benchmark summary. Treat that range as context, not as a target detached from your traffic mix.
For a landing-page test, click-based conversion can be useful when the question is, “What happens after someone clicks this ad?” It becomes misleading if one variant is measured on clicks and the other on sessions. The same visitor can generate multiple sessions, while one click may lead to several visits or a delayed purchase.
Email needs even more care. A rate based on recipients measures the campaign's total selling efficiency. A rate based on clickers measures what happens after engagement. Both can be valid, but calling them the same conversion rate hides the difference.
You can also use a pre-sell page CVR guide from Landra to check the arithmetic, but a calculator won't fix an incorrectly defined event or denominator. Write the definition beside the report before you enter the figures.
Which Denominator You Pick Changes Everything
A session-based rate counts conversion events against visits. It works well for store-level questions such as, “How efficiently did this traffic produce orders?” It can count repeat visits separately, which is useful when the store is evaluating visit efficiency.
A user-based rate asks how many distinct people converted. It's better suited to questions about individual reach or user cohorts, but it can look stronger than a session rate when shoppers return several times before buying.
A click-based rate evaluates the post-click journey. It's useful for judging an ad and its destination together, though the click definition and attribution window need to remain stable. Advertising platforms may count clicks and attributed conversions differently from an analytics or commerce platform, so the labels shouldn't be treated as interchangeable.
| Denominator | What It Counts | Where You See It | When To Use It |
|---|---|---|---|
| Sessions | Visits to the site or page | Ecommerce and analytics reporting | Store efficiency and page performance |
| Users | Distinct people or devices, depending on implementation | User and cohort reports | Reach, returning behavior, and user-level analysis |
| Clicks | Ad or campaign clicks | Paid-media reporting | Post-click landing-page and campaign analysis |
The important question isn't which denominator is universally best. It's which denominator fits the decision. If you're deciding whether a product page handles store traffic efficiently, session-based reporting is defensible. If you're evaluating whether an ad drives valuable visitors after the click, click-based reporting can be more useful.
Lock the choice before an A/B test starts. Keep the denominator, event definition, attribution window, and audience rules identical for both variants. Switching from sessions to clicks after seeing an unfavorable result is the fastest way to ship a false winner.
The practical rule is short: pick one denominator per question and stop there. Keep separate reports when you have separate questions. Don't compress session CVR, user CVR, and click CVR into one blended score just to make the dashboard look tidy.
Benchmarks That Actually Mean Something by Channel and Temperature
A blended ecommerce average hides the variable that usually matters most to a DTC operator: intent. Cold paid social, branded search, direct traffic, email, and retargeting don't represent the same buying moment, so their conversion rates shouldn't be judged against one store-wide number.
Recent ecommerce reporting places many store-session benchmarks between 1.4% and 2.7%, while broader cross-industry guidance often uses a 2% to 5% range for digital conversion actions. Coursera's conversion rate overview emphasizes that the appropriate benchmark depends on the industry and action being measured. A purchase, lead form, and account creation aren't equivalent events.
| Channel or audience | Traffic temperature | Useful benchmark context | What to inspect |
|---|---|---|---|
| Paid social prospecting | Cold | Compare with the store-session ecommerce range, not a warm-audience rate | Message match, awareness stage, and page format |
| Non-branded search | Mixed | Separate informational intent from purchase intent | Query intent and landing-page alignment |
| Branded search and direct | Warm to hot | Avoid comparing it with broad prospecting traffic | Product familiarity and navigation behavior |
| Email and SMS | Warm | Define whether the denominator is recipients, clicks, or purchasers | Campaign engagement and offer relevance |
| Retargeting | Warm | Read it separately from new-user traffic | Attribution window and returning-user share |
The spread between average and top-performing stores is also meaningful. One Shopify-focused sample reported a 1.4% median, with the top 20% at 2.6% or higher and the top 10% at 3.4% or higher, according to ClickMinded's conversion-rate statistics review. Those figures show dispersion, not a universal pass mark.
A pre-sell page aimed at cold traffic may look weak beside a retargeting report and strong beside a broad feed campaign. Both interpretations can be correct if the audience, denominator, and conversion event differ. The useful comparison is usually within the same source, device group, offer, and page type.
For operators testing advertorials or listicles, this guide to conversion rates for pre-sell pages is more relevant than a generic store average because the page is doing a different job from a product detail page. It warms the visitor and earns the next click. Judge that path by the eventual purchase, but also monitor whether the page creates qualified movement rather than only superficial engagement.
Why Your Conversion Rate Looks Low Before Anything Is Broken
A low percentage doesn't prove that the page is broken. It proves that the chosen report contains fewer recorded conversions than the chosen denominator. The diagnosis starts by separating measurement problems from persuasion problems.
First, check whether the report compares the same unit. A click-based campaign rate beside a session-based store rate is not a fair comparison. Pull the data by source and page, then label each report with its denominator.
Next, separate cold and returning audiences. A store-level figure that combines new paid-social visitors with existing customers can conceal both problems. The blended number may look ordinary while cold traffic struggles and returning traffic performs efficiently.
Attribution can also make a healthy funnel look weak. Confirm that the attribution window matches the buying cycle for the channel. If a visitor clicks an ad, researches the product, and returns later through another route, the first platform may not receive credit for the eventual order.
A dashboard is only as trustworthy as the event, denominator, and attribution rules behind it.
Privacy and browser changes can create another gap between platform reports and orders. Reconcile reported conversions against a server-side or order-ID count where possible. Then check whether refunds are removed from one report but retained in another, because a “conversion” can mean an order created, an order paid, or an order retained depending on the system.
Finally, inspect the funnel steps. If one report uses ad-platform attribution, another uses last click, and the checkout report uses order creation, the steps don't share a measurement model. You can still use each report, but you shouldn't add them together or treat their rates as sequentially comparable.
A 0.8% store CVR, for example, could be acceptable for one cold audience and alarming for a high-intent branded segment, but that conclusion requires the relevant source and denominator. The number alone never tells you what to fix. Start with segmentation, then investigate page friction only after the measurement survives that audit.
Where Pre-Sell Pages Fit and When They Backfire
Consider a skincare brand sending cold Meta traffic straight to a product detail page. The visitor sees the product, price, variants, reviews, navigation, and checkout path, but may not yet understand why this product fits the problem described in the ad.
A pre-sell page changes the sequence. It can open with the problem, explain the mechanism or routine, present relevant proof, handle the main objection, and lead to one product decision. The product detail page still handles the deeper shopping questions, but it receives a visitor with more context.
That structure works when the page matches the visitor's awareness stage. Cold social traffic often needs education and trust before it wants product specifications. A warm visitor who already follows the brand may need less narrative and more direct access to the product, price, shipping, and reviews.
Why the format can create lift
The page format removes competing decisions. A focused pre-sell page can limit navigation, keep one offer visible, and align its headline with the ad hook. It also gives the marketer a place to test the angle itself, rather than forcing every hypothesis into a product template.
The result isn't magic, and it isn't proof that pre-sell pages always outperform PDPs. It's a structural response to a structural mismatch. When cold visitors need a reason to care, a narrative page can perform better than a catalog-style product page because it answers the question that comes before “Which variant should I buy?”
Practical trust-building presell page tactics include matching the ad promise, using proof that addresses the central objection, and making the next step unmistakable. The page should earn the click to the product, not bury it beneath unrelated education.
When the approach backfires
Pre-sell pages can slow down traffic that already knows what it wants. Branded search, repeat purchasers, and engaged followers may prefer the PDP because they're looking for product details rather than a warm-up narrative.
They can also underperform for high-consideration products where buyers need specifications, comparisons, compatibility information, or technical documentation. A single-offer page is a poor fit for a catalog where cross-sell and browsing are central to the buying experience.
No page format rescues a weak offer. If the price, proof, guarantee, availability, or product-market fit doesn't withstand scrutiny, adding a longer story only delays the objection. Use pre-sell pages as a traffic-temperature tool, then compare them within matched audiences and consistent measurement rules.
A Short Optimization Plan You Can Run This Week
Start with measurement, not a headline rewrite. The fastest CRO win is often discovering that two teams are reporting different denominators while arguing about the same page.
Lock the reporting view. Choose session-based or click-based reporting for the specific question. Document the conversion event, attribution window, audience filters, and source of truth. Keep those rules unchanged across the test.
Split pages by traffic temperature. Build a cold-traffic version for prospecting, a shorter path for warm followers, and a direct product route for branded intent. Don't send every audience through the same narrative just because the store has one canonical PDP.
Test the message before cosmetic details. For the cold page, prepare three distinct ad hooks and three matching headlines, then test one offer variation. A button-color test won't resolve a mismatch between the ad's promise and the page's opening.
Answer the main objection directly. Add one response mechanism tied to the page's biggest hesitation. That might be proof, a demonstration, a guarantee explanation, shipping clarity, or a comparison. Choose it from customer questions and page behavior, not from a generic CRO checklist.
Use a holdout and track micro-conversions. Keep a control path so the lift has a defensible comparison. Track scroll depth, time on page, product clicks, add-to-cart, and checkout starts before optimizing only for the final order. These signals won't replace purchase CVR, but they can show where the new page changes behavior.
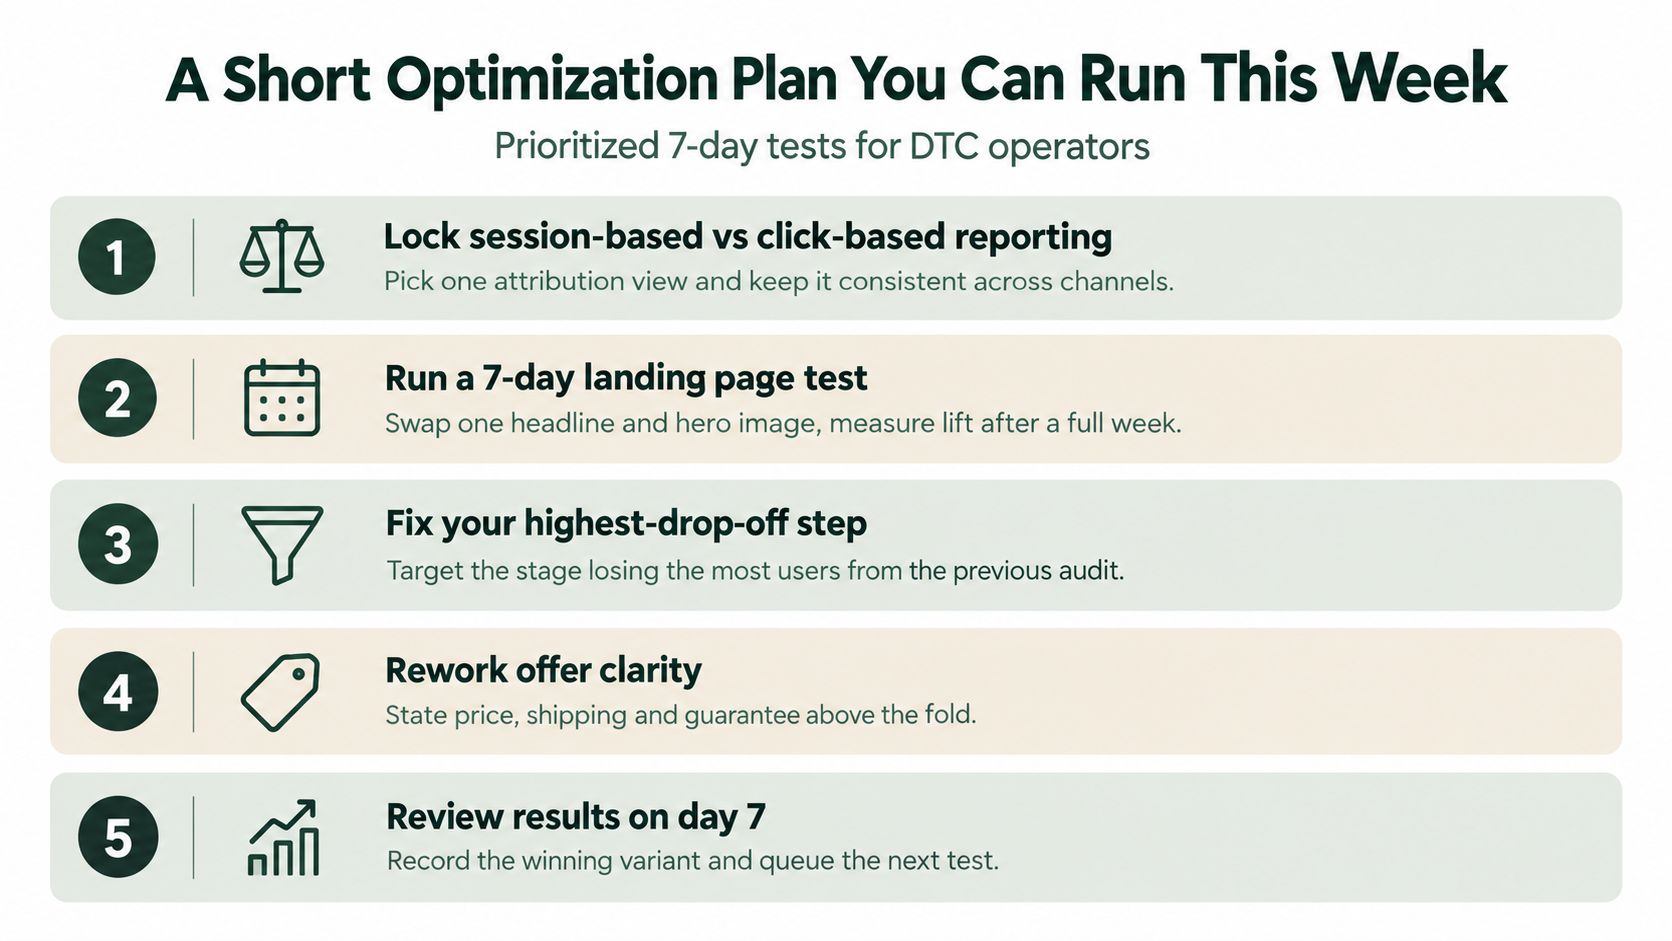
Run the first comparison for a complete weekly cycle rather than calling a winner after a few noisy hours. Record the audience mix and conversion definition alongside the result. If you want a broader checklist of practical testing ideas, this guide on how to boost conversion rate in 2025 is a useful reference, but apply every recommendation through your own measurement setup.
The point of a seven-day sprint isn't to finish CRO. It's to produce one clean comparison that tells you whether the problem sits in measurement, audience fit, page format, offer clarity, or a specific funnel step. Once you know that, the next test becomes a business decision instead of a design opinion.
Landra generates editable advertorial, listicle, and pre-sell landing pages from a product or brand URL, with publishing options for Shopify, Webflow, a hosted URL, or HTML export. Visit Landra to create a traffic-matched pre-sell page, define the conversion event, and start testing the path between paid social clicks and completed orders.