

Personalization can reduce customer acquisition costs by as much as 50%, according to the Buy with Prime summary of McKinsey's 2023 finding. That number is a useful warning against treating every visitor as the same conversion problem. Real conversion rate improvement starts by finding where each kind of visitor leaves, matching the page to their awareness, and judging the result on completed purchases and revenue per visitor, not clicks.
Table of Contents
- Find the Stage Where Visitors Leave
- Match the Page to the Visitor's Awareness
- Measure Segments That Mislead Your Results
- How to Run a Test That Proves a Lift
- Fix Checkout Friction That Absorbs the Gain
- Choose Your First Test This Week
Find the Stage Where Visitors Leave
A flat conversion rate can hide four different leaks: ad to landing page, product or pre-sell page, cart, and checkout. One stage may improve while another worsens. Find where visitors leave before changing the headline, because a page edit will not fix a checkout failure.
Track each step and form interaction, then segment results by device, country, traffic source, new versus returning users, and payment method. Data Hunters Agency's conversion optimization guide offers a framework for diagnosing conversion issues. Landra's guide to shopper behavior can help you think through how behavior differs across visitor groups rather than relying on an overall average.
Checkout deserves its own diagnosis. The Baymard Institute checkout usability benchmark reports a global average cart abandonment rate of about 70.19%. It also gives a form-length reference: roughly 12 to 14 form elements for an optimized flow, compared with 23.48 displayed by default in an average US flow.
Read Each Stage Separately
| Funnel stage | Metric to compare | Warning sign | First check |
|---|---|---|---|
| Ad to landing page | Load time and bounce rate by device | Mobile visitors leave before the page loads; Google's benchmark reports that 53% leave after 3 seconds | Time the page on a mid-range phone |
| Product or pre-sell page | Add-to-cart rate by traffic source | Cold social traffic adds to cart far below warm traffic | Compare the page's first claim with the ad's promise |
| Cart | Cart-to-checkout start rate | Shipping or tax cost appears only at payment | Show the full total earlier in the flow |
| Checkout | Checkout completion rate by device | Forced account creation or a form longer than about 12 to 14 elements | Count fields and offer guest checkout |
Rank leaks by absolute loss, not percentage alone. A stage losing 500 visitors a week deserves attention before a page that lost 30% of only 40 visits. The percentage shows how severe the leak is; the volume indicates its potential impact.
Practical rule: Name the stage with the biggest absolute weekly loss, then choose the single metric that would confirm the leak.
Use that audit to choose the next test. If mobile checkout completion trails desktop, investigate the checkout before commissioning a new advertorial. If cold traffic leaves before the product page renders, fix the loading problem before rewriting checkout copy.
Early-stage improvement does not guarantee more purchases. More shoppers may reach checkout only to fail at payment or cancel, so judge each diagnosis by completed purchases and revenue per visitor, not click-through rate alone.
Match the Page to the Visitor's Awareness
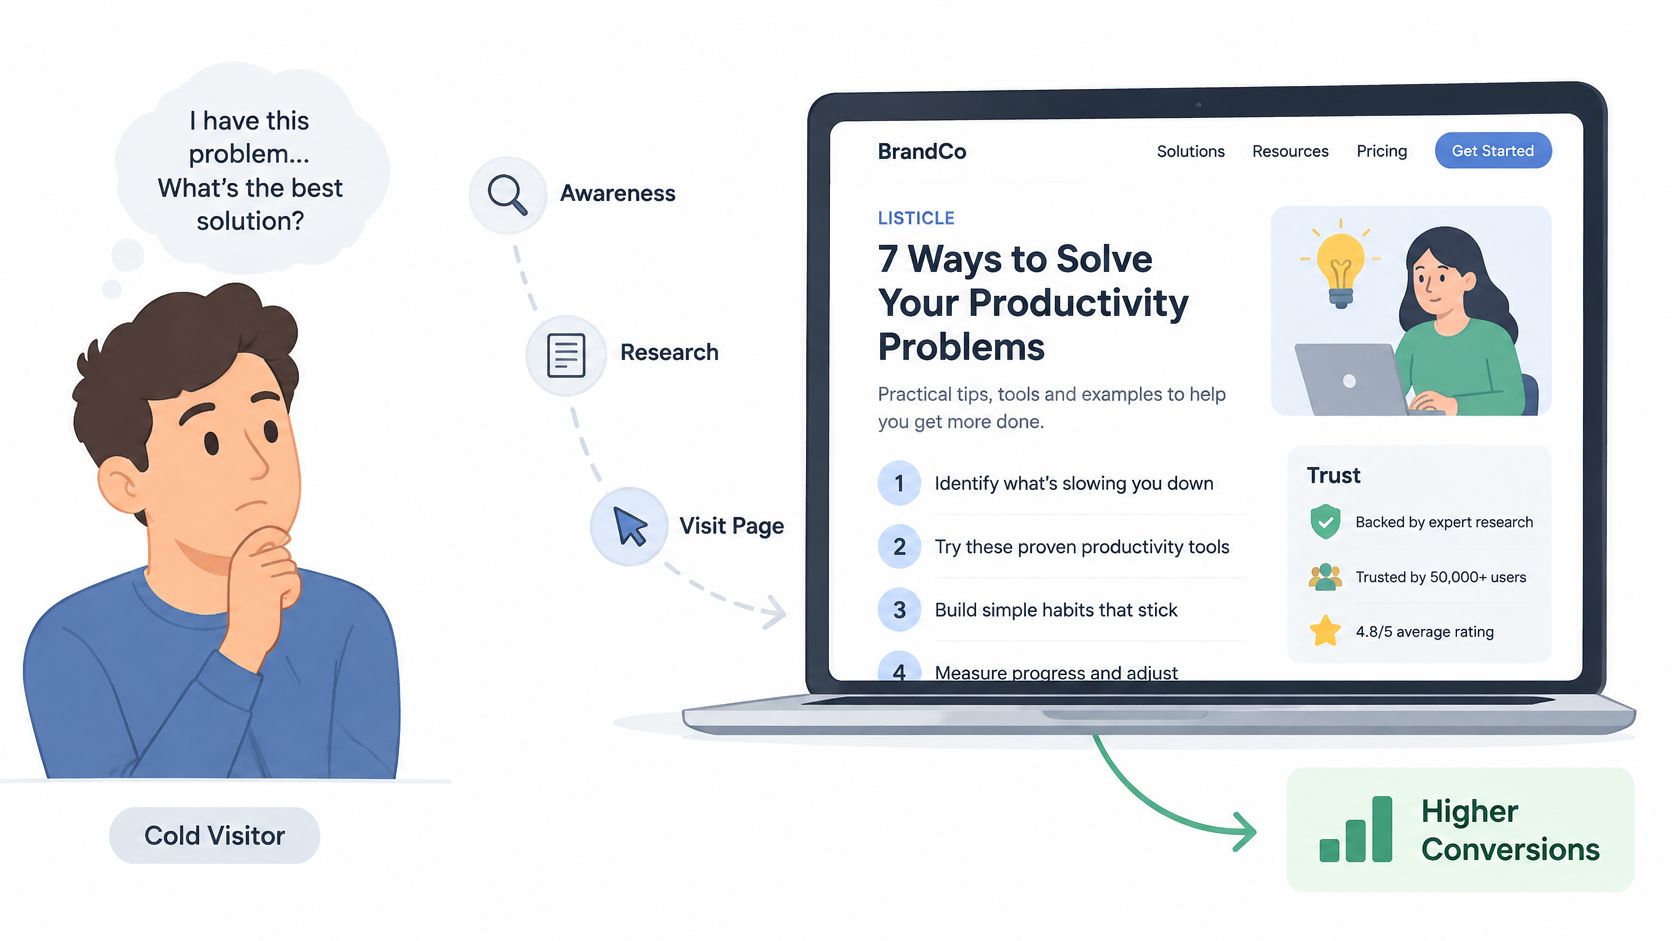
Awareness decides the format, not traffic temperature alone. A cold visitor may never have heard of your brand but already feel the problem every day. That person doesn't need a long origin story. They need a fast, credible reason to believe your product solves a problem they've already accepted.
The journey below shows the cold path that works when the opening speaks to a felt problem before it asks for a click.
Choose the Format by Awareness
| Traffic group | Awareness stage | Page format to start with | Skip the pre-sell when |
|---|---|---|---|
| Cold paid social | Does not yet feel the problem | Advertorial with narrative | Never skip for high-consideration products |
| Cold paid social | Feels the problem, unaware of your brand | Problem-led listicle | Product is an impulse or low-price buy |
| Warm or brand-aware | Knows your product and category | Product page or product-led listicle | Pre-sell adds a step the reader does not need |
| Retargeting | Comparing options | Product-led listicle or product page | Visitor has already compared and is ready to buy |
Use a belief test before you commit. Higher priced, education heavy, or commodity products in resistant categories like supplements and beauty devices usually need a pre-sell to earn agreement on the problem, the mechanism, and the proof. Impulse, low price, and self explanatory products often convert better straight to the product page, where an extra page is just friction.
Say a $140 skincare device ad on Meta lands on a clean product page with a working Add to Cart button. The shopper leaves in four seconds, not because the button failed, but because the page asked for a buying decision before she'd agreed she had the problem or that this device addressed it. A problem led listicle changes the order, problem first, options second, product last. For trust building inside that sequence, see the practical notes on building buyer trust with social proof, especially placement near the first serious claim.
Speed caps whatever format you choose. Google's mobile page speed benchmarks report that 53% of mobile visitors leave a page when it takes longer than three seconds to load. The same analysis found that moving from 400 to 6,000 page elements cut predicted conversion probability by 95%, so a long, heavy pre-sell can defeat its own argument.
The video below is worth watching for how quickly the first screen has to confirm the ad promise on a phone.
Keep the offer identical when you test formats. Change only the opening angle, then judge whether agreement, not curiosity, carried more shoppers to the product page.
Measure Segments That Mislead Your Results
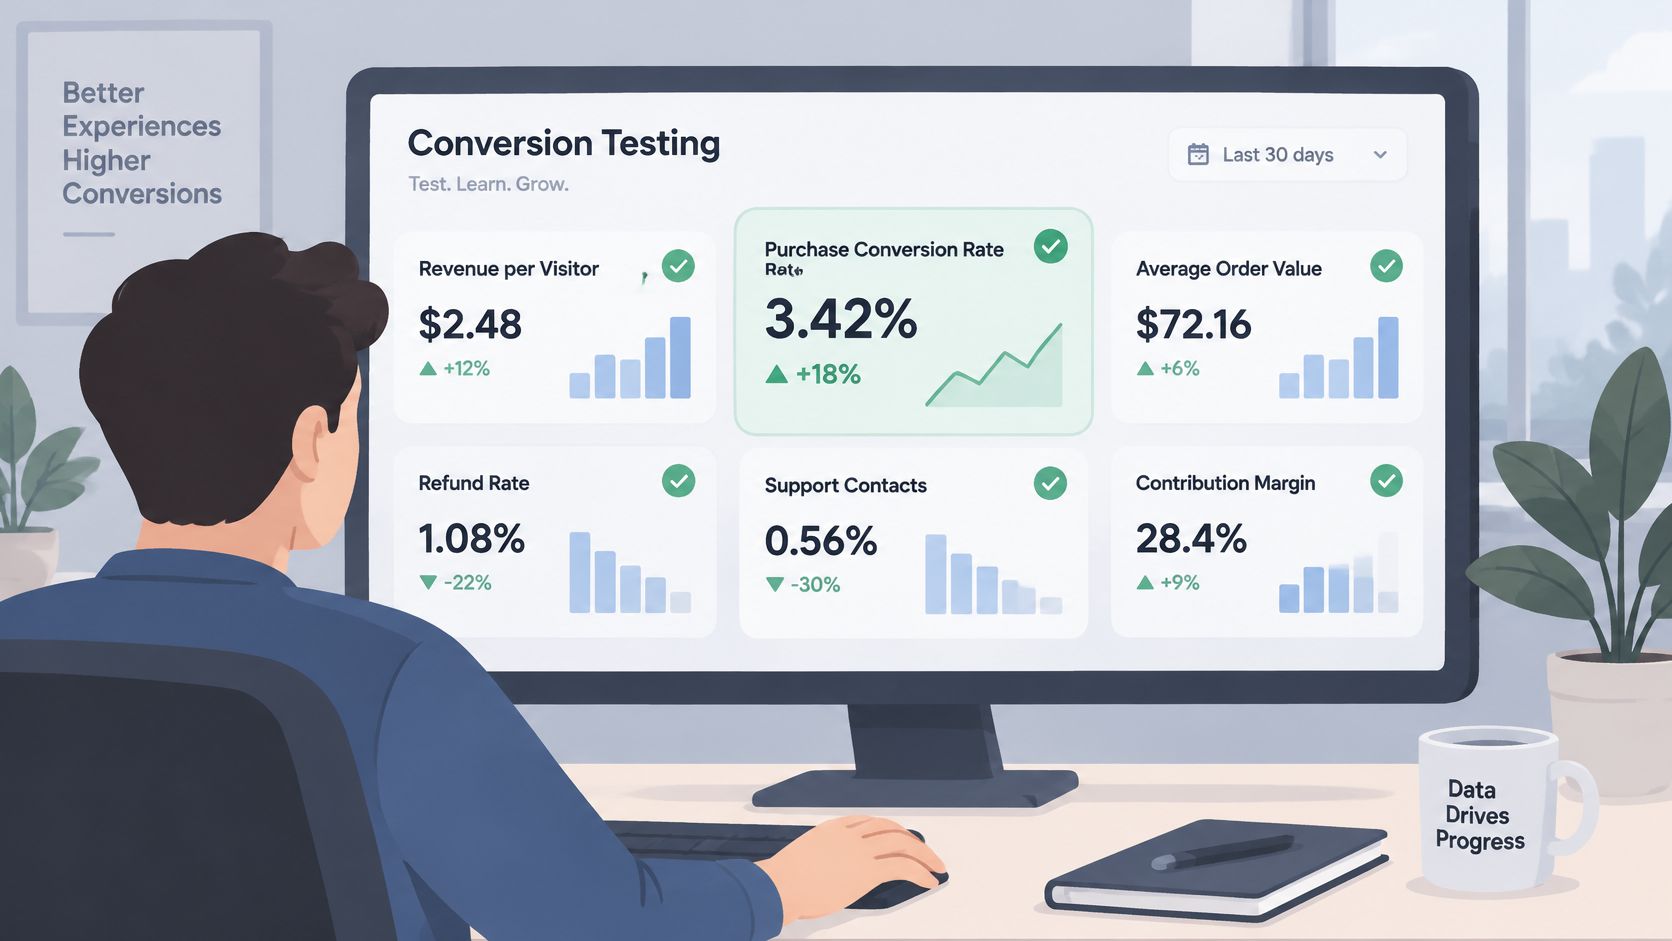
Set your guardrails before any test starts, because the easiest number to move is usually the weakest proof. Completed purchases are the primary metric. Alongside it, watch revenue per visitor, average order value, refund rate, support contacts, and contribution margin.
A headline that doubles clicks but lowers revenue per visitor is a loss wearing a good costume. Curiosity gets people through a door. It doesn't mean more of them paid, kept the product, or left support alone.
The dashboard view below is the right habit, several metrics side by side rather than one celebrated rate.
Give AI Referred Traffic Its Own Segment
Don't fold AI referred sessions into organic or referral and call the blend a benchmark. Adobe Analytics reporting on generative AI traffic found that visits from generative AI sources to US retail websites rose 1,200% between July 2024 and February 2025. Those visits were still 9% less likely to convert than other sources in February 2025, a sharp improvement from a 43% shortfall in July 2024.
A gap that moves that fast makes static channel benchmarks unreliable. Measure AI sessions separately across:
- Landing page engagement: whether the visitor stays, scrolls, and clicks with intent.
- Product discovery and add to cart: whether comparison ready shoppers find answers fast.
- Checkout and assisted conversions: whether the visit pays now or returns through another channel.
- Revenue per visitor: whether smaller volume produces better or worse economics.
These shoppers often arrive with a comparison already formed by an assistant's answer, plus specific questions about claims, ingredients or specs, pricing, shipping, and objections. Sending them the same cold social advertorial can waste that intent. Test pages built for answerability, with claims, qualifications, comparisons, and delivery terms stated plainly enough for both a shopper and an assistant to read accurately.
A segment average can improve because the mix changed, not because the page got better.
Before you report any result, confirm four things. The planned sample was reached, the stopping rule was met, guardrails stayed flat, and segment cuts were recorded after the test ended. If one fails, you have a signal to investigate, not a decision to ship.
How to Run a Test That Proves a Lift
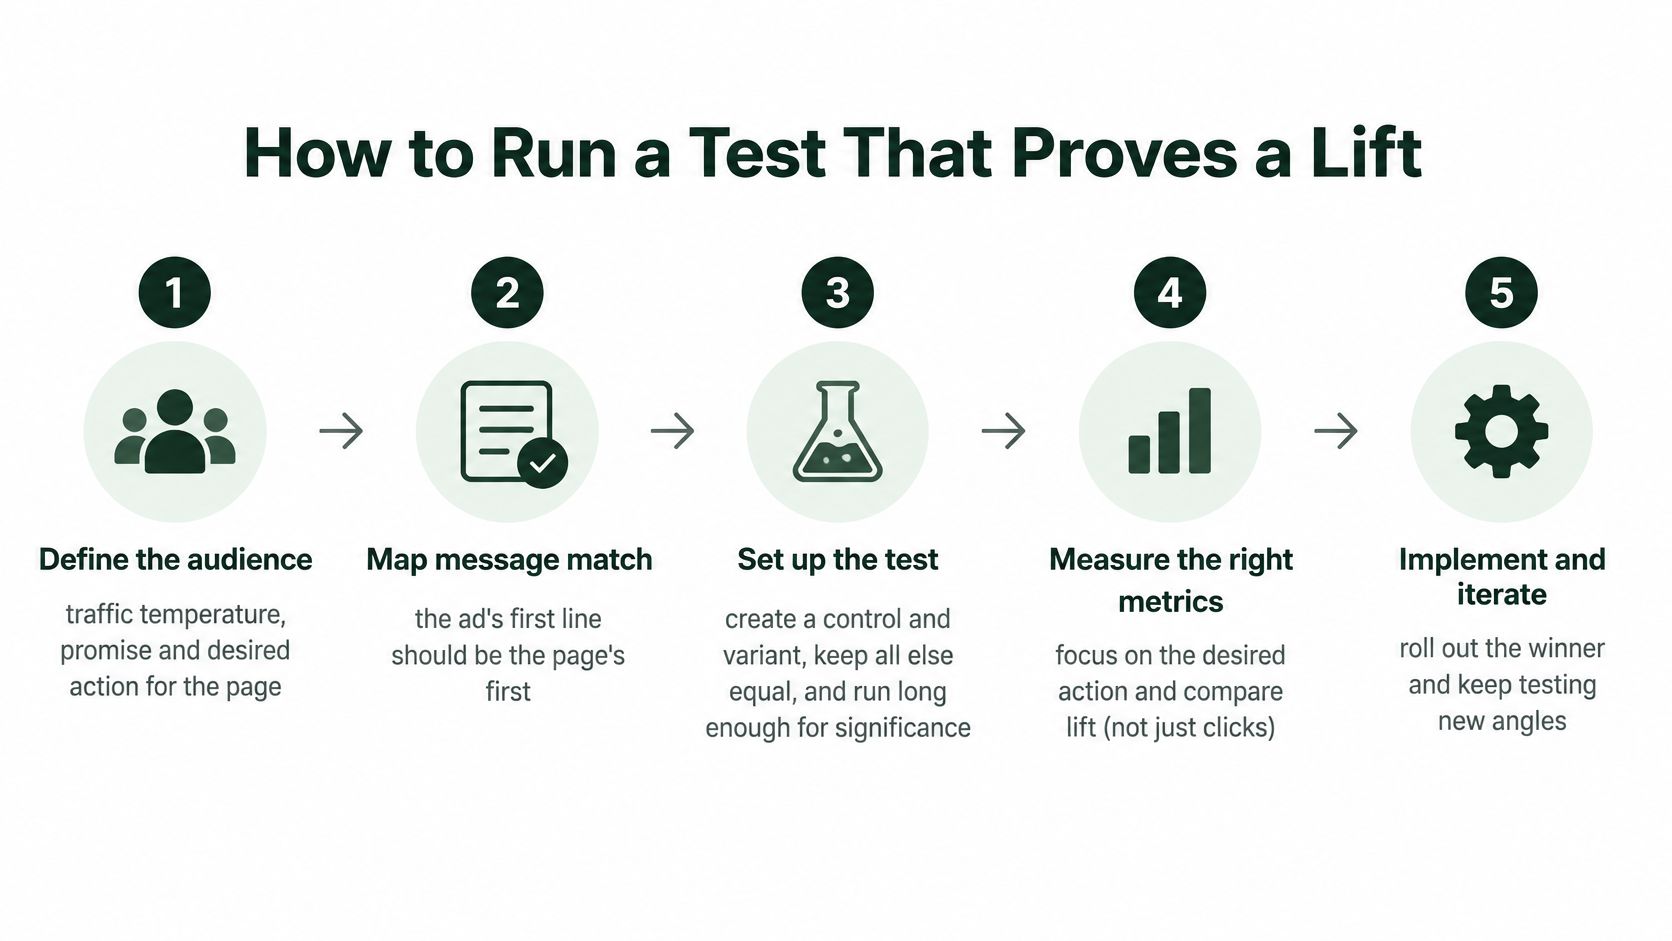
Most failed tests don't fail because the idea was bad. They fail because the team changed the headline, layout, proof, and offer together, peeked daily, and declared a winner from clicks. The sequence below prevents that. It also reflects the discipline in Landra's guide to A/B testing, one hypothesis, one primary metric, one decision rule.
The process summary gives you the order to follow before any variant goes live.
There's headroom almost everywhere you look. Baymard Institute checkout usability research rated 65% of sites mediocre or worse for checkout performance and only 2% good. Treat that as a diagnostic benchmark, not a promised uplift for your store.
Run the Eight Steps in Order
- Define the test. Name the audience, traffic temperature, promise, and desired action. The common slip is writing a page for cold social and judging it with mixed warm traffic.
- Map message match. The ad's first line should become the page's first claim, in the same words where possible. If the ad promised help for knee pain on stairs, the page can't open with a general wellness story.
- Set a baseline. Measure over a complete business cycle, at least one full week and ideally two. Weekday and weekend buyers behave differently, and a three day baseline can invent a lift that was only payday timing.
- Score hypotheses. Rank ideas by expected impact, confidence, and effort. Start with the idea touching your biggest absolute leak, not the idea your team can build before lunch.
- Build one distinct variant. Change the opening angle, proof placement, or CTA timing. Don't also change price, bundle, and layout, or you'll never know which lever moved purchases.
- Fix the rules before launch. Choose purchases or qualified checkout starts as the primary metric, never clicks alone. Calculate sample size from your baseline rate, the smallest lift worth detecting, a significance level commonly set at 0.05, and statistical power commonly set at 0.8, then write the number and stopping rule in the test log.
- Wait for the stopping rule. Don't call a winner on an early spike. Novelty, a strong ad set, or one good evening can reverse, and stopping early turns noise into policy.
- Segment only after it ends. Cut results by device, source, and new versus returning once the test is closed. Peeking by segment during the run invites false discoveries, because you'll keep slicing until something looks significant.
For cold paid social, the highest value variables are usually opening angle, advertorial or listicle structure, proof placement, CTA timing, mobile rendering, and speed. Keep the offer and attribution setup stable while you test them.
Test log in one line: hypothesis, primary metric, sample reached, decision.
If the result isn't significant, log it as inconclusive. A directional lift is not a win you can bank, and calling it one pollutes every later decision.
Fix Checkout Friction That Absorbs the Gain
A better pre-sell can still lose money. If it lifts add to cart but sends those extra shoppers into a checkout with surprise costs, forced accounts, and a long form, checkout absorbs the gain and you conclude the page failed. The page may have done its job. The last step didn't.
The Baymard Institute cart abandonment research puts the global average cart abandonment rate at 70.19%. Its US shopper findings below tell you which frictions to attack first, in the order shoppers cite them.
| Abandonment trigger | Share of US shoppers | Fix to test |
|---|---|---|
| Extra costs such as shipping, taxes or fees | 40% | Show the full total before payment |
| Delivery too slow | 20% | Show delivery dates on the product page |
| Distrust with credit-card information | 19% | Add trust cues at the payment step |
| Forced account creation | 18% | Offer guest checkout |
| Checkout too long or complicated | 17% | Cut fields toward 12-14 elements |
Fix Them in Impact Order
Start with total cost visibility. Show shipping, tax, and fees before payment, ideally in the cart and again at checkout start. A shopper who discovers the full total at the card field feels misled, and even a fair price reads as a trap at that point.
Next, put guest checkout where a first time buyer can't miss it. Account creation can come after the order, when you can offer order tracking as the benefit. Forcing it before payment trades a sale today for data you may never get.
Then count your fields, including dropdowns, address lines, and optional boxes shown by default. Cut toward the 12 to 14 element range by hiding company and second address fields behind a toggle, using address autocomplete, and removing any field your fulfillment doesn't require. Clarify error messages at the field that failed, not in a banner the shopper has to decode.
Cover the remaining triggers where they occur. Put concrete delivery dates on the product page, not shipping windows in a policy page, and place payment trust cues beside the card fields, where hesitation peaks. Our practical notes on how to recover revenue from abandoned carts cover the follow up side once these onsite fixes are in place.
Measure mobile checkout completion separately throughout. A pre-sell that works on phones can push more mobile shoppers into a weak mobile checkout and reduce total orders, even while its own click rate improves.
That's why I'd pair a promising pre-sell variant with one checkout fix and judge the pair on completed purchases and profit. Baymard's 35.26% figure is a modeled opportunity estimate for large sites from solvable usability problems, not a guaranteed result for your store. It tells you the lever is real. Your test tells you its size.
Choose Your First Test This Week
Start from the stage you named in your diagnosis, then take the matching fix from the page and checkout work above. Don't pick the test that's fashionable. Pick the one attached to your largest absolute loss.
Say your advertorial holds attention and add to cart looks healthy, but mobile checkout completion sits well below desktop. Your first test is a checkout fix, showing full costs earlier or adding guest checkout, not another advertorial angle. Writing a sharper page would send more shoppers into the same wall.
Day one is paperwork, and it's the cheapest discipline you'll buy. Write the hypothesis, the primary metric as completed purchases, the sample size, and the stopping rule. Use free tooling where it helps. We offer a Headline Analyzer, a Conversion Rate Calculator, and a Compliance Checklist, and our AI Presell Page Generator creates warm-up pages that build intent ahead of checkout when the leak is at the page stage.
Launch one variant against a live control. Keep traffic sources separate, change one element, and let the test run to its stopping rule without reviewing early spikes. Segment only after it ends, then apply the keep or return rule.
Keep the variant only if completed purchases and revenue per visitor both improve and guardrails stay flat.
If either one fails, return to diagnosis, pick the next biggest absolute loss, and write a new hypothesis. We don't promise a set lift in conversion. We promise pages shipped, which is what makes the next test possible this week instead of next quarter.
If your diagnosis points to the page stage, generate the variant, test one angle against your control, and let completed purchases decide. Visit Landra to build mobile first advertorial and listicle pages from your product URL and ship your first test this week.